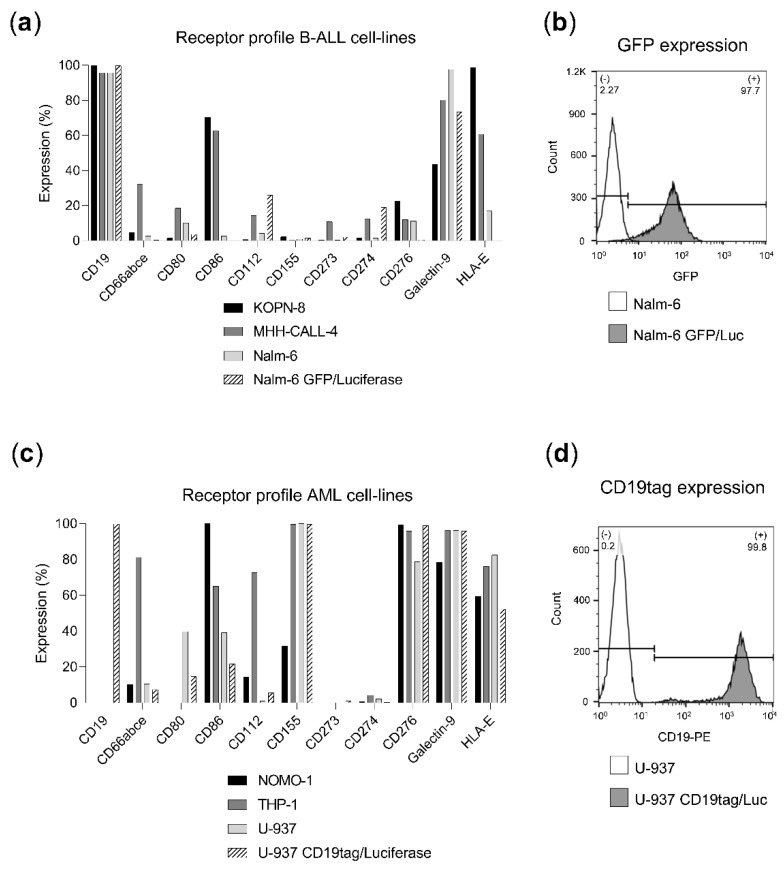
Figure 1.
Ligand profile characterization of leukemia cell lines. Percentage of ligand or GFP-expressing cells was determined by flow cytometry. (a) Ligand expression in B-ALL cell lines (KOPN-8, MHH-CALL-4, Nalm-6 and Nalm-6 GFP/Luc). (b) GFP expression of Nalm-6 GFP/Luc (grey) in comparison to non-transduced Nalm-6 (white). (c) Ligand expression in AML cell lines (NOMO-1, THP-1, U-937 and U-937 CD19tag/Luc). (d) CD19 expression of U-937 CD19tag/Luc (grey) in comparison to non-transduced U-937 (white).

