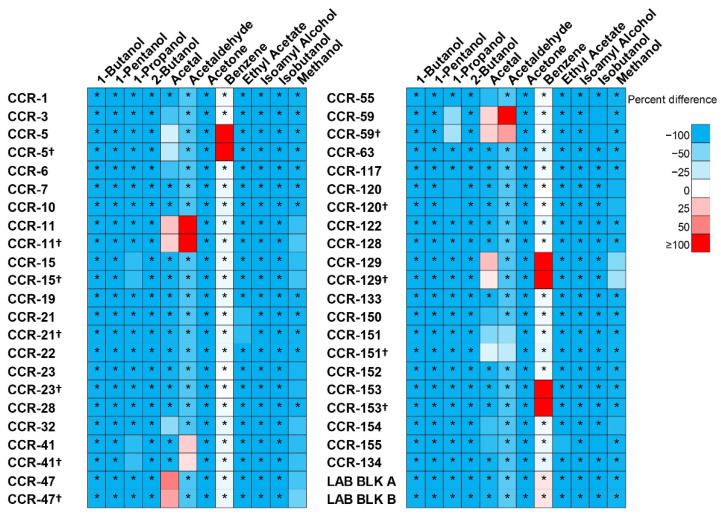
Figure 3.
Impurity concentrations (expressed as percent difference relative to FDA specifications). Duplicate samples noted with † (expressed as percent difference relative to FDA specifications). Cells denoted with asterisks (*) refer to instances when impurity concentrations were equivalent to one half LOQ.

