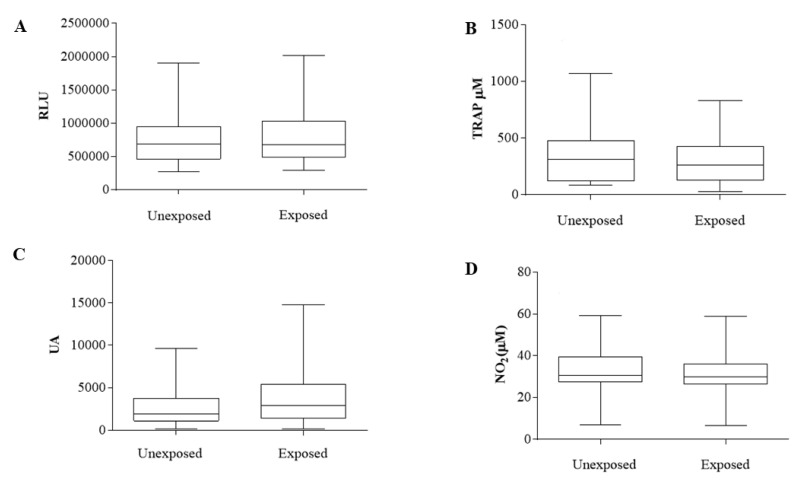
Figure 2.
Oxidative stress analysis of plasma samples of exposed and unexposed breast cancer patients from intermediate-risk stratification. (A) Plasma hydroperoxide levels, measured in RLU = relative light units. (B) Total plasma antioxidant capacity (TRAP), measured in nM of Trolox. (C) Oxidation index in arbitrary units. (D) Levels of nitric oxide metabolites, measured in μM. Results are represented in box plots (min–max). Analyses were performed with GraphPad Prism 7.0 (GraphPad Software. San Diego, CA, USA).

