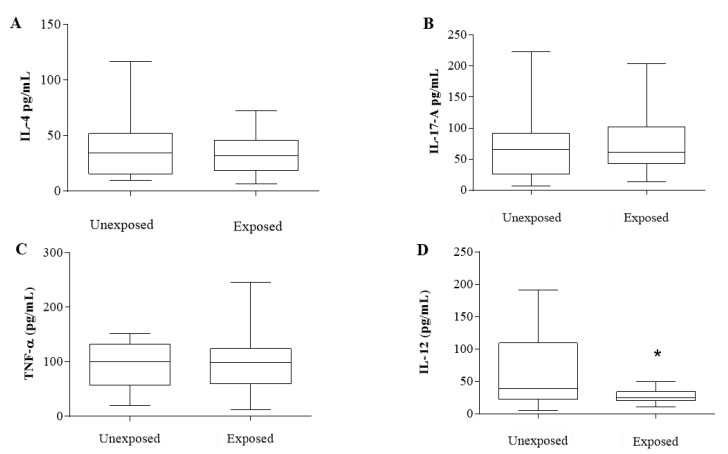
Figure 3.
Cytokine profile of exposed and unexposed breast cancer patients from intermediate-risk stratification. (A) Interleukin 4. (B) Interleukin 17-A. (C) TNF-α. (D) Interleukin 12. All measured in pg/mL. Results are represented in box plots (min–max). * Indicates statistically significant difference (p < 0.05). Analyses were performed with GraphPad Prism 7.0 Software (San Diego, CA, USA).

