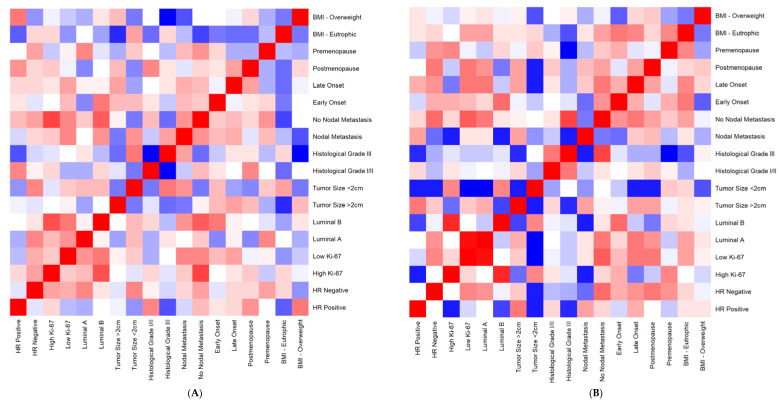
Figure 4.
Heatmap: correlation analysis of clinicopathological data according to systemic levels of IL-12 of exposed and unexposed breast cancer patients from intermediate-risk stratification. (A) Exposed group. (B) Unexposed group. The analysis was performed with R programming language (R Development Core Team. 2021). Red squares indicate positive correlations. Blue squares indicate the negative ones. A more intense color indicates a stronger correlation.

