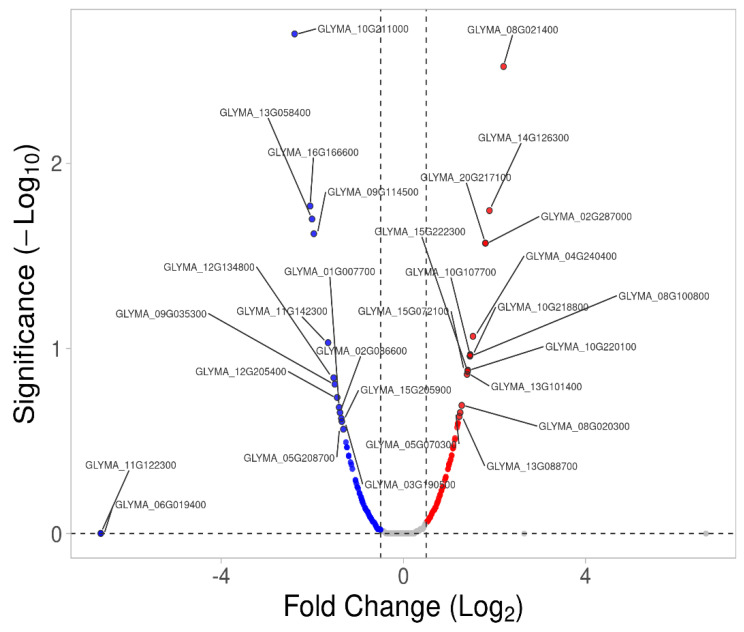
Figure 6.
Up- and down-regulated membrane proteins in roots identified using label-free quantification, with a −log10 p-value > 0.05 and |fold change| value > 0.5. Red dots represent up-regulated proteins and blue dots represent down-regulated proteins. Gray dots represent membrane proteins with unchanged expressions.

