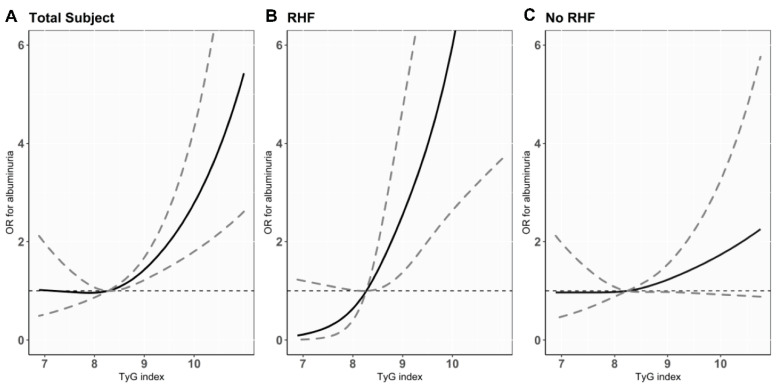
Figure 2.
Cubic spline curves for the risk of albuminuria according to TyG index in total study participants (A) and participants with RHF (B) or without RHF (C). Black lines show ORs per 1.0 increase of TyG index and gray dashed lines represent 95% CIs. Abbreviations: TyG index—triglyceride glucose index; RHF—renal hyperfiltration; OR—odds ratio; CI—confidence interval.

