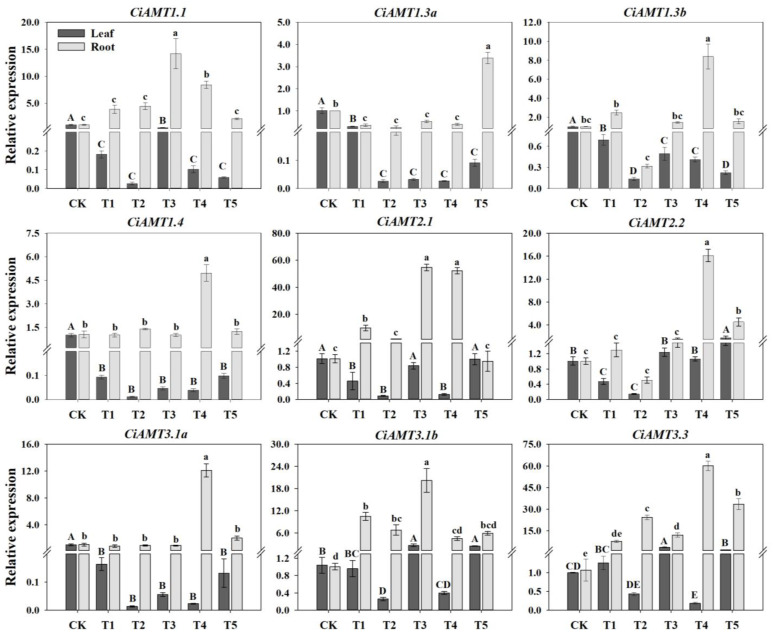
Figure 5.
Relative expression of pecan CiAMT genes under varying NH4+:NO3− ratios. The expression levels of CiAMT in pecan leaves and roots after varying NH4+:NO3− ratio treatments were quantified by qRT-PCR, with Actin as the reference gene. Different capital letters indicate significant differences in leaves (p < 0.05), and different lowercase letters indicate significant differences in roots (p < 0.05).

