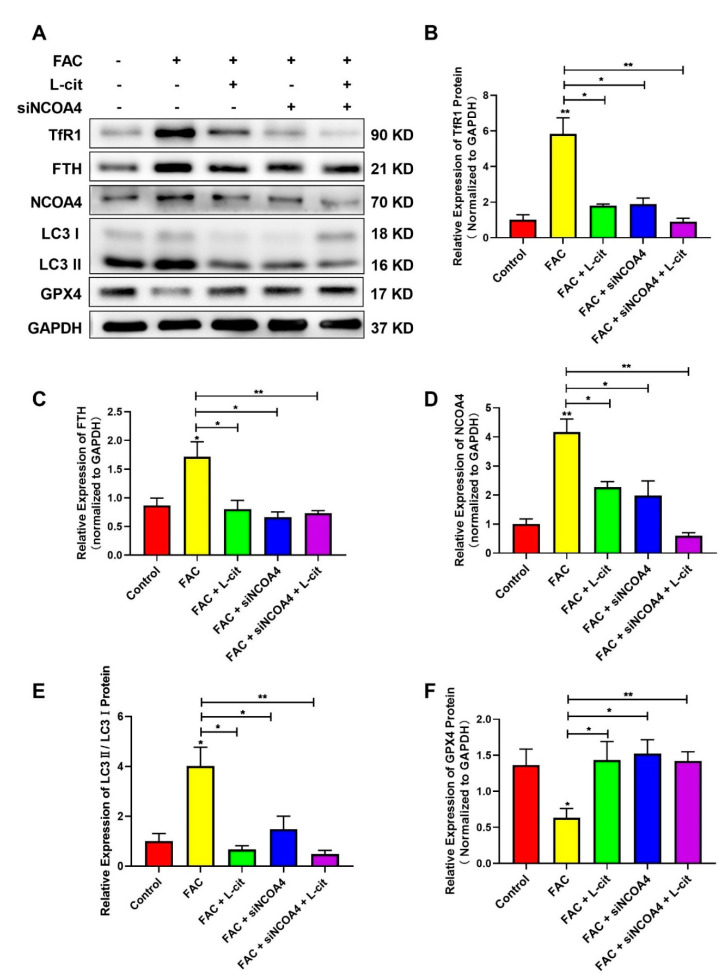
Figure 8.
L-cit restrains ferritinophagy to suppress ferroptosis induced by FAC in mTEC1 cells. The mTEC1 cells were transfected with 50 nM siNCOA4, followed by 2 mM L-cit, and treated with 200 μM FAC for 24 h. (A,B) Immunoblot analyses of TFR1. (A,C) Immunoblot analyses of FTH. (A,D) Immunoblot analyses of NCOA4. (A,E) Immunoblot analyses of LC3. (A,F) Immunoblot analyses of GPX4. GAPDH was used as the loading control. Values represent mean ± SEM. of three independent experiments. Significant differences are represented by * p < 0.05, ** p < 0.01.

