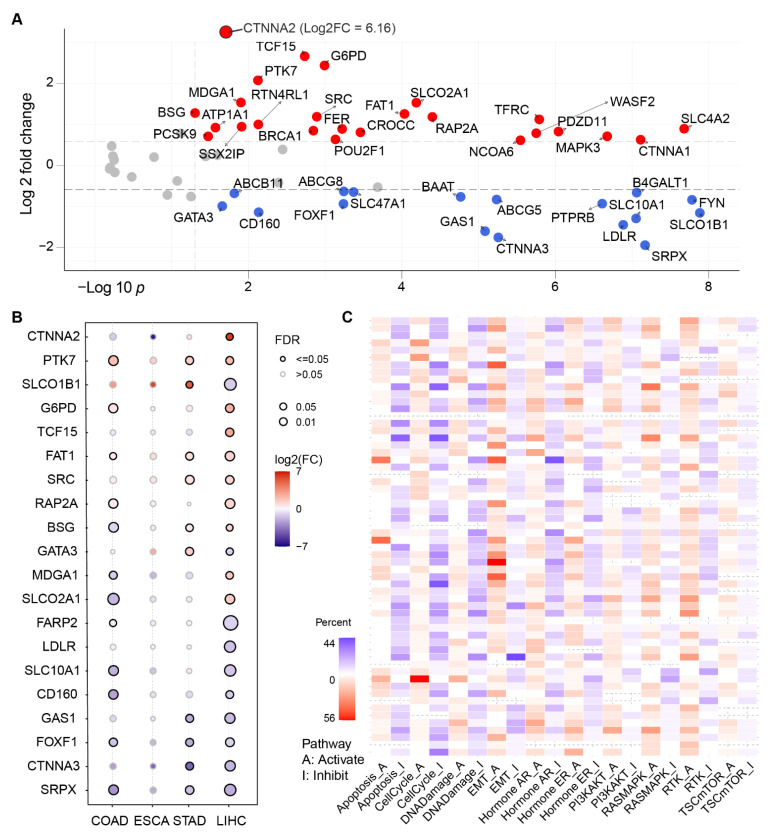
Figure 2.
The differential expression analysis of the selected polarity-related genes (PRGs) with clinical value in different tumor tissues and paracancerous tissues of the digestive system from the cancer genome atlas (TGCA) database. (A) Volcano plot of 61 PRGs expression change between tumor and matching normal tissues from liver hepatocellular carcinoma (LIHC) with fold change >1.5 and FDR p < 0.05. CTNNA2 was separately illustrated. (B) The mRNA expression level of selected polarity-related genes across colon adenocarcinoma (COAD), esophageal carcinoma (ESCA), stomach adenocarcinoma (STAD), and LIHC datasets. The larger circle, the more statistically significant. (C) EMT and cell cycle pathway are the mostly disrupted by the selected polarity genes across all cancer types deposited in TCGA. The color in each cell indicates that the percentage of altered pathway occurrence in evaluated cancer types. Red for activation, blue for inhabitation.

