Figure 5.
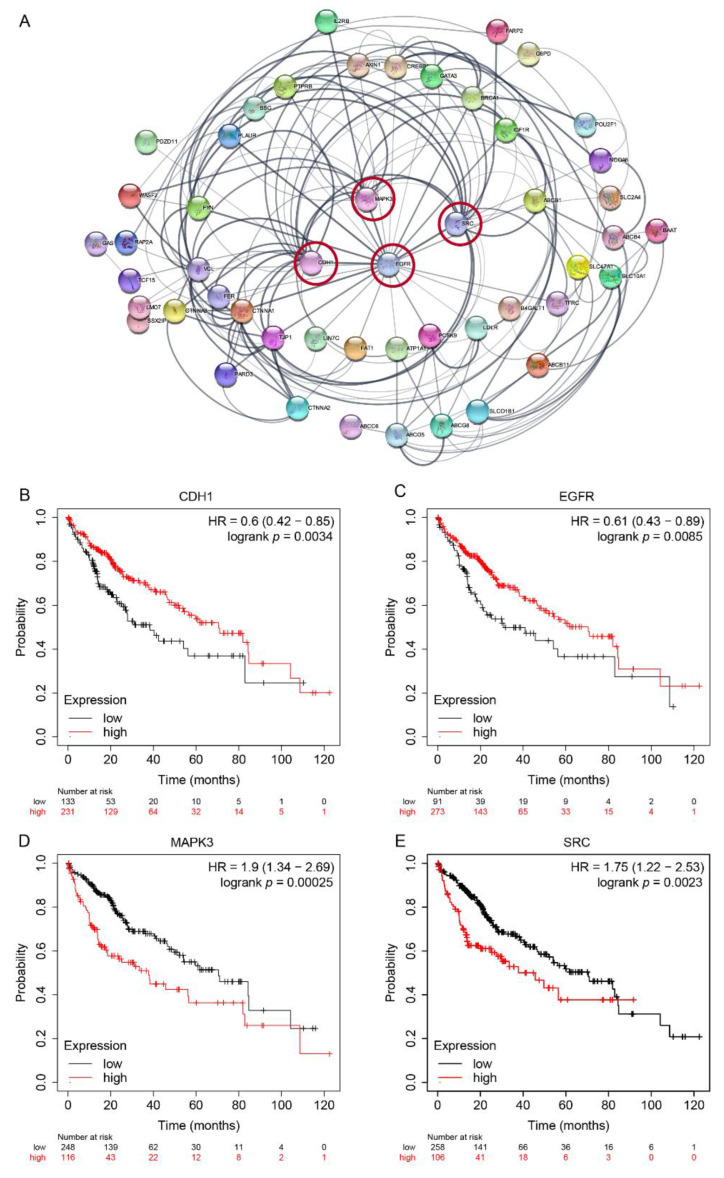
Network and survival curve of polarity-related genes with clinical value. (A) Protein–protein interaction (PPI) network of prognostic polarity-related genes. Thickness of connection denotes strongness of interaction evidence. The nodes with highest degree of connectivity were circled. (B–E) Survival curves of selected top four genes emerged from PPI network.

