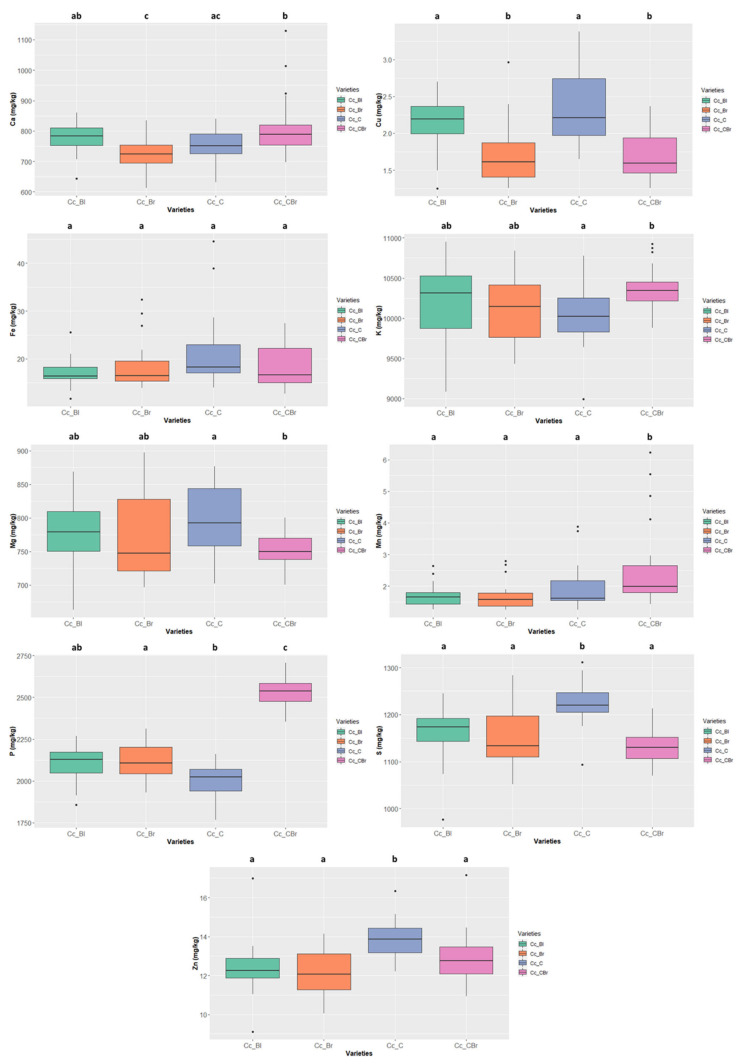
Figure 8.
Variation of the content of the 9 minerals quantified in the different colour types of Cajanus cajan. The box represents the 25th, 50th (median), and 75th percentiles, while the whiskers represent the 10th and 90th percentiles with minimum and maximum observations. The dots represent the outliers. Different lower-case letters indicate significance differences (p < 0.05) between species.

