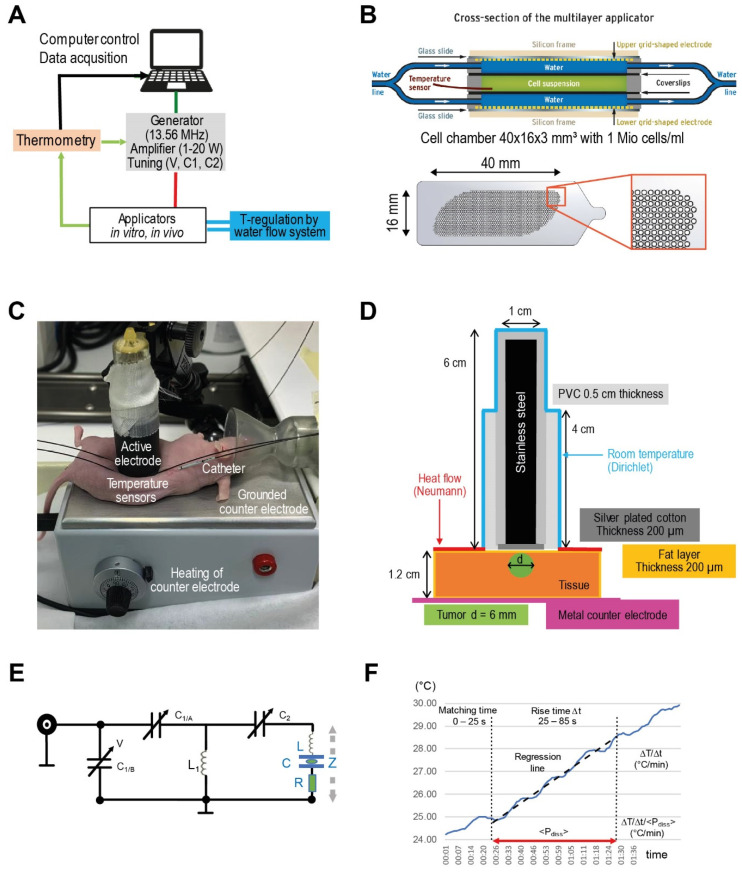
Figure 1.
(A) Experimental system. Schematic of LabEHY-200 system for preclinical in vitro and in vivo studies. With reference to the clinical system EHY-2000+ [8], we initially set the AM-spectrum to 100/f (f ≥ 100 Hz). (B) In vitro applicator. Schematic cross-section of the in vitro applicator, which is suitable to adjust the power density (via Padj) and temperature (via water flow system) separately. The grid-shaped electrodes (below) enabled enlargement of the cell chamber volume (green) up to ~2 mL. (C) In vivo applicator. Components of the in vivo applicator in situ as positioned upon an implanted HT29 tumor in a nude mouse. (D) Model of in vivo applicator. The exposed volume is much smaller than for the in vitro applicator, resulting in a Padj = 1 W. Particularly, calculating temperature distributions is a nontrivial task because of this complicated geometry. (E) Tuning circuit. Tuning circuit for the in vitro applicator with adjustable capacitances C1/C2, which are controlled by the voltage V. The complex impedance Z is specified by the fixed inductance L (air coil) in a pre-tuning unit, the capacitance C and a variable lossy resistance R, depending on the load and operation mode. (F) Evaluation procedure for the temperature gradient after the power is turned on. Standardized evaluation of ΔT/Δt (°C/min) in the in vitro applicator after switching on the power (Padj = 10 W) under flow conditions in three steps (1–3): (1): Fixed tuning time of 25 s to achieve <Pdiss> = Padj with a reflected power of <5%. (2): Determination of the slope ΔT/Δt of the regression line in the time interval 25–85 s (red line). (3): Correction of the temperature gradient with respect to the mean Pdiss during this time interval.

