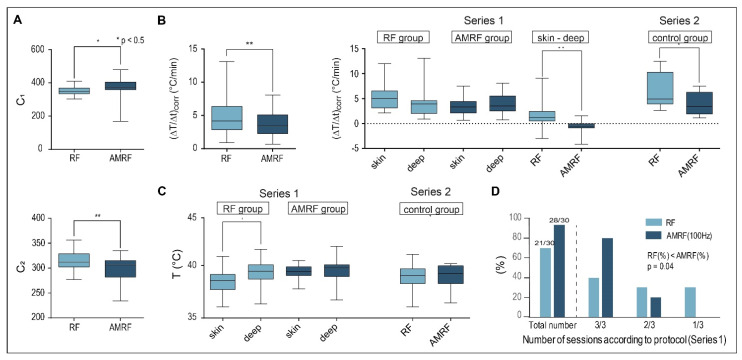
Figure 6.
(A) Tuning capacitances in vivo. Values obtained for C1 and C2 in vivo show the same qualitative behavior as those achieved in vitro (Figure 1B,C), with even higher statistical significance. We included all completed RF and AMRF treatments in this analysis. (B) Corrected power deposition in vivo. The initial temperature gradients (ΔT/Δt)corr (corrected for the dissipated power) in vivo behave similar to the in vitro measurements (Figure 3A) if all RF and AMRF measurement points were compared. The temperature gradients as a function of the locations (superficial versus deep in the tumor center) and techniques (RF versus AMRF) suggest that the thermally relevant power density is higher and more nonhomogeneous for RF in comparison to AMRF. (C) Location-dependent temperatures in vivo. Mean Tmax in tumor-related superficial and intratumoral deep measurement points broken down by RF (light) and AMRF (dark) for series 1 (left panel) and series 2 (right panel). Even though the thermal power is less for AMRF, the measured temperatures are comparable and more homogeneous. (D) Feasibility and tolerance. Three sessions per mouse were intended in series 1 (RF group versus AMRF group with 2 × 10 mice). The number of successfully completed sessions is significantly higher in the AMRF group. Significance was defined as p < 0.05 and marked with * (< 0.005 with **, etc.)

