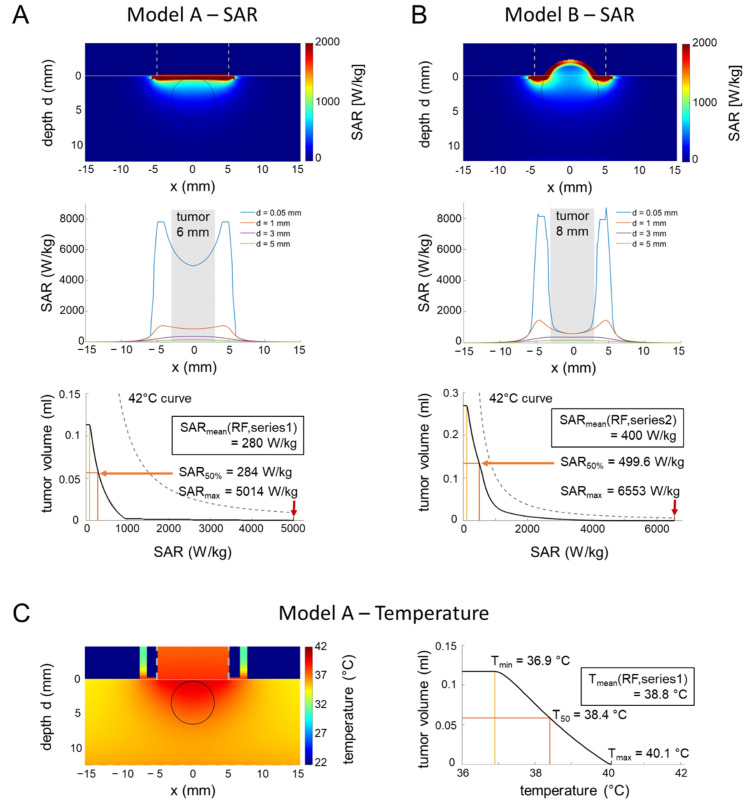
Figure 7.
(A) SAR simulations in an in vivo applicator (small tumor). Two-dimensional SAR distribution (top), depth profiles near the surface (middle), and SAR volume histogram of the tumor for model A representing series 1 with small tumors (6 mm in diameter) during the induction phase. The SAR volume histogram of the tumor is far below the 42 °C curve. SARmin, SAR50% and SARmax are marked with yellow, orange and red markers respectively. However, overheating might be possible outside the tumor at the applicator edge under unfavorable conditions (see profile at depth d = 0.05 mm). (B) SAR simulations in an in vivo applicator (large tumor). For model B with larger tumors (8 mm in diameter), the SAR volume histogram yields higher SAR than for model A but is still below the 42 °C curve (please note the adapted scale of the y-axis). Similar to model A, overheating might be possible outside the tumor at the applicator edge with similar SAR peaks (see the profile at depth d = 0.05 mm). (C) Simulation of temperature distributions. The temperature distribution for model A with the applicator model of Figure 7B and the thermal parameters of Table 1B confirm the estimations of the SAR analysis. The temperature volume histogram of the tumor shows a maximum temperature of 40.1 °C.

