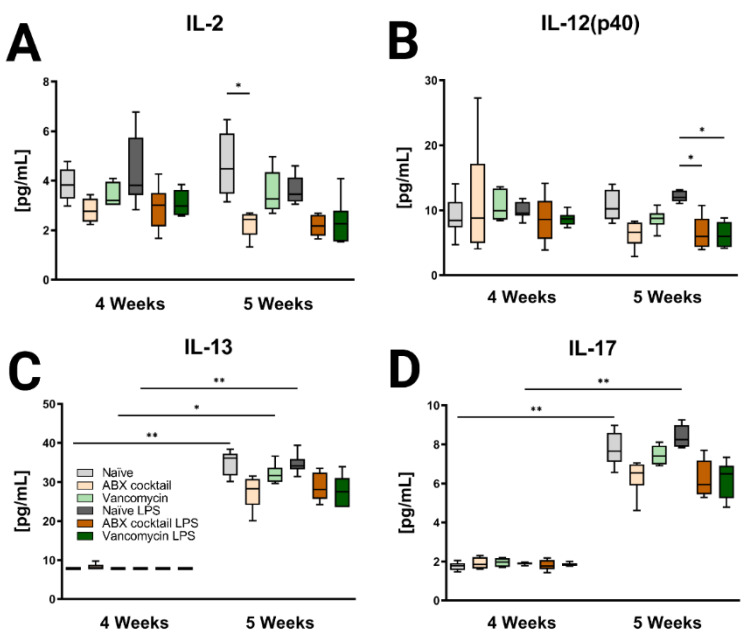
Figure 6.
Inducible brain cytokines are affected by maternal ABX treatment. Data showing the responses of (A) IL-2, (B) IL-12(p40), (C) IL-13, and (D) IL-17 at 4 and 5 weeks. Naïve = light grey, ABX cocktail = light brown, Vancomycin = light green, Naïve LPS = grey, ABX cocktail LPS = brown and Vancomycin LPS = green. n = 6 for all groups. Kruskal–Wallis with Dunn’s multiple comparison test. Values represent median + interquartile range means ± SEM, * p ≤ 0.05, ** p ≤ 0.01.

