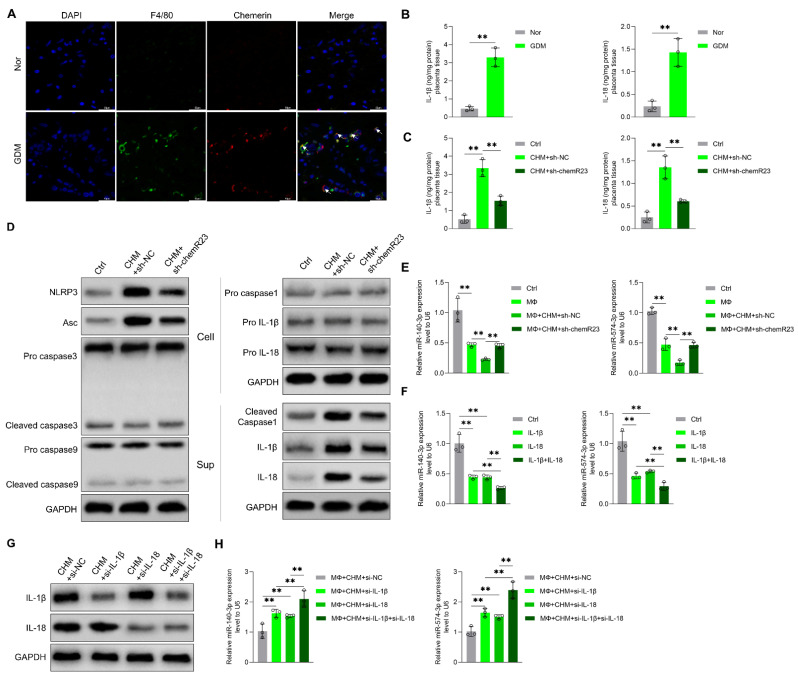
Figure 4.
Chemerin-induced placental inflammation-regulated trophoblast cell-derived exosomal miR-140-3p and miR-574-3p expression. (A) Immunofluorescence staining for F4/80 (macrophages) and chemerin of placenta tissue in normal and GDM pregnant women. (B) Content of IL-18 and IL-1β in placenta tissue of normal and GDM pregnant women was measured by ELISA (n = 3). (C) Content of IL-18 and IL-1β in placenta tissue of Ctrl, CHM+sh-NC, and CHM+sh-chemR23 mice was measured by ELISA (n = 3). (D) Protein levels of NOD-like receptor family pyrin domain containing 3 (NRLP3), apoptosis-associated speck-like protein containing CARD (Asc), pro caspase 3, cleaved caspase 3, pro caspase 9, cleaved caspase 9, pro caspase 1, cleaved caspase 1, pro-IL-1β, and pro-IL-18 in placental macrophages were measured by Western blotting. Protein levels of cleaved caspase 1, IL-1β, and IL-18 in the culture supernatants of placental macrophages were measured by Western blotting as well. Glyceraldehyde-3-phosphate dehydrogenase (GAPDH) served as the internal control (n = 3). (E) Trophoblast cells were co-incubated with control (Ctrl), the supernatant from macrophage, macrophage+CHM+sh-NC, and macrophage+CHM+sh-chemR23 for 24 h, then relative exosomal miR-140-3p and miR-574-3p expression was measured by qRT-PCR (n = 3). (F) Trophoblast cells were treated with Control, recombinant protein IL-18, recombinant protein IL-1β, and recombinant protein IL-18+IL-1β. Relative exosomal miR-140-3p and miR-574-3p expression was measured by qRT-PCR (n = 3). (G) Changed protein levels of IL-18 and IL-1β in macrophage after treatment with chemerin and siRNA NC (CHM+si-NC), IL-1β siRNA (CHM+si-IL-1β), IL-18 siRNA (CHM+si-IL-18) and IL-1β siRNA and IL-18 siRNA (CHM+si-IL-1β+si-IL-18) were measured by Western blotting (n = 3). (H) Trophoblast cells were co-incubated with the supernatant of macrophage+CHM+si-NC, macrophage+CHM+si-IL-1β, macrophage+CHM+si-IL-18, and macrophage+CHM+si-IL-1β+si-IL-18, then relative exosomal miR-140-3p and miR-574-3p expression was measured by qRT-PCR (n = 3). ** p < 0.01. Scale bar: 50 μm.

