Figure 5.
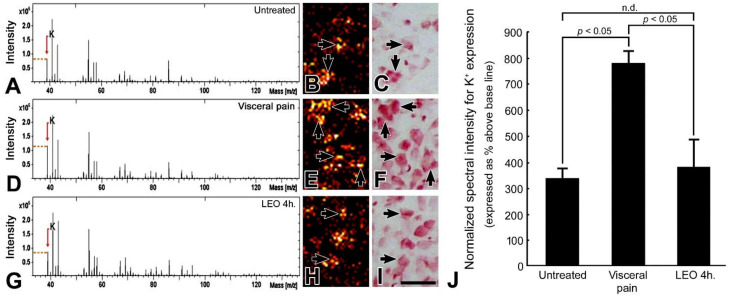
TOF-SIMS-positive spectra (A,D,G), ionic imaging (B,E,H), corresponding histological staining with H&E (C,F,I), and histogram (J) show the K+ expression in the CeA of the untreated (A–C), visceral pain (D–F), and OS with LEO for 4 h (G–I) groups. Note that in untreated group, only moderate K+ intensity (A) with significant intracellular localization (arrows, B) was detected in the CeA. However, following the induction of visceral pain, the amygdaloid K+ expression was drastically increased in both terms of spectral intensity (D) and ionic imaging (E). Nevertheless, in rats subjected to visceral pain and treated with LEO, the amygdaloid K+ expression was successfully returned to nearly normal levels in which only a mild level of K+ signal was detected in the CeA (G,H). Arrows in (B,E,H) indicates the intracellular localization of the K+ signal as verified by the H&E staining in (C,F,I). Data from normalized spectral intensity analysis corresponded well with imaging findings in which OS effectively decreased the CeA K+ intensity (J). n.d. = no significant difference. Scale bar = 50 μm in ionic and histological imaging.

