
Figure 3.
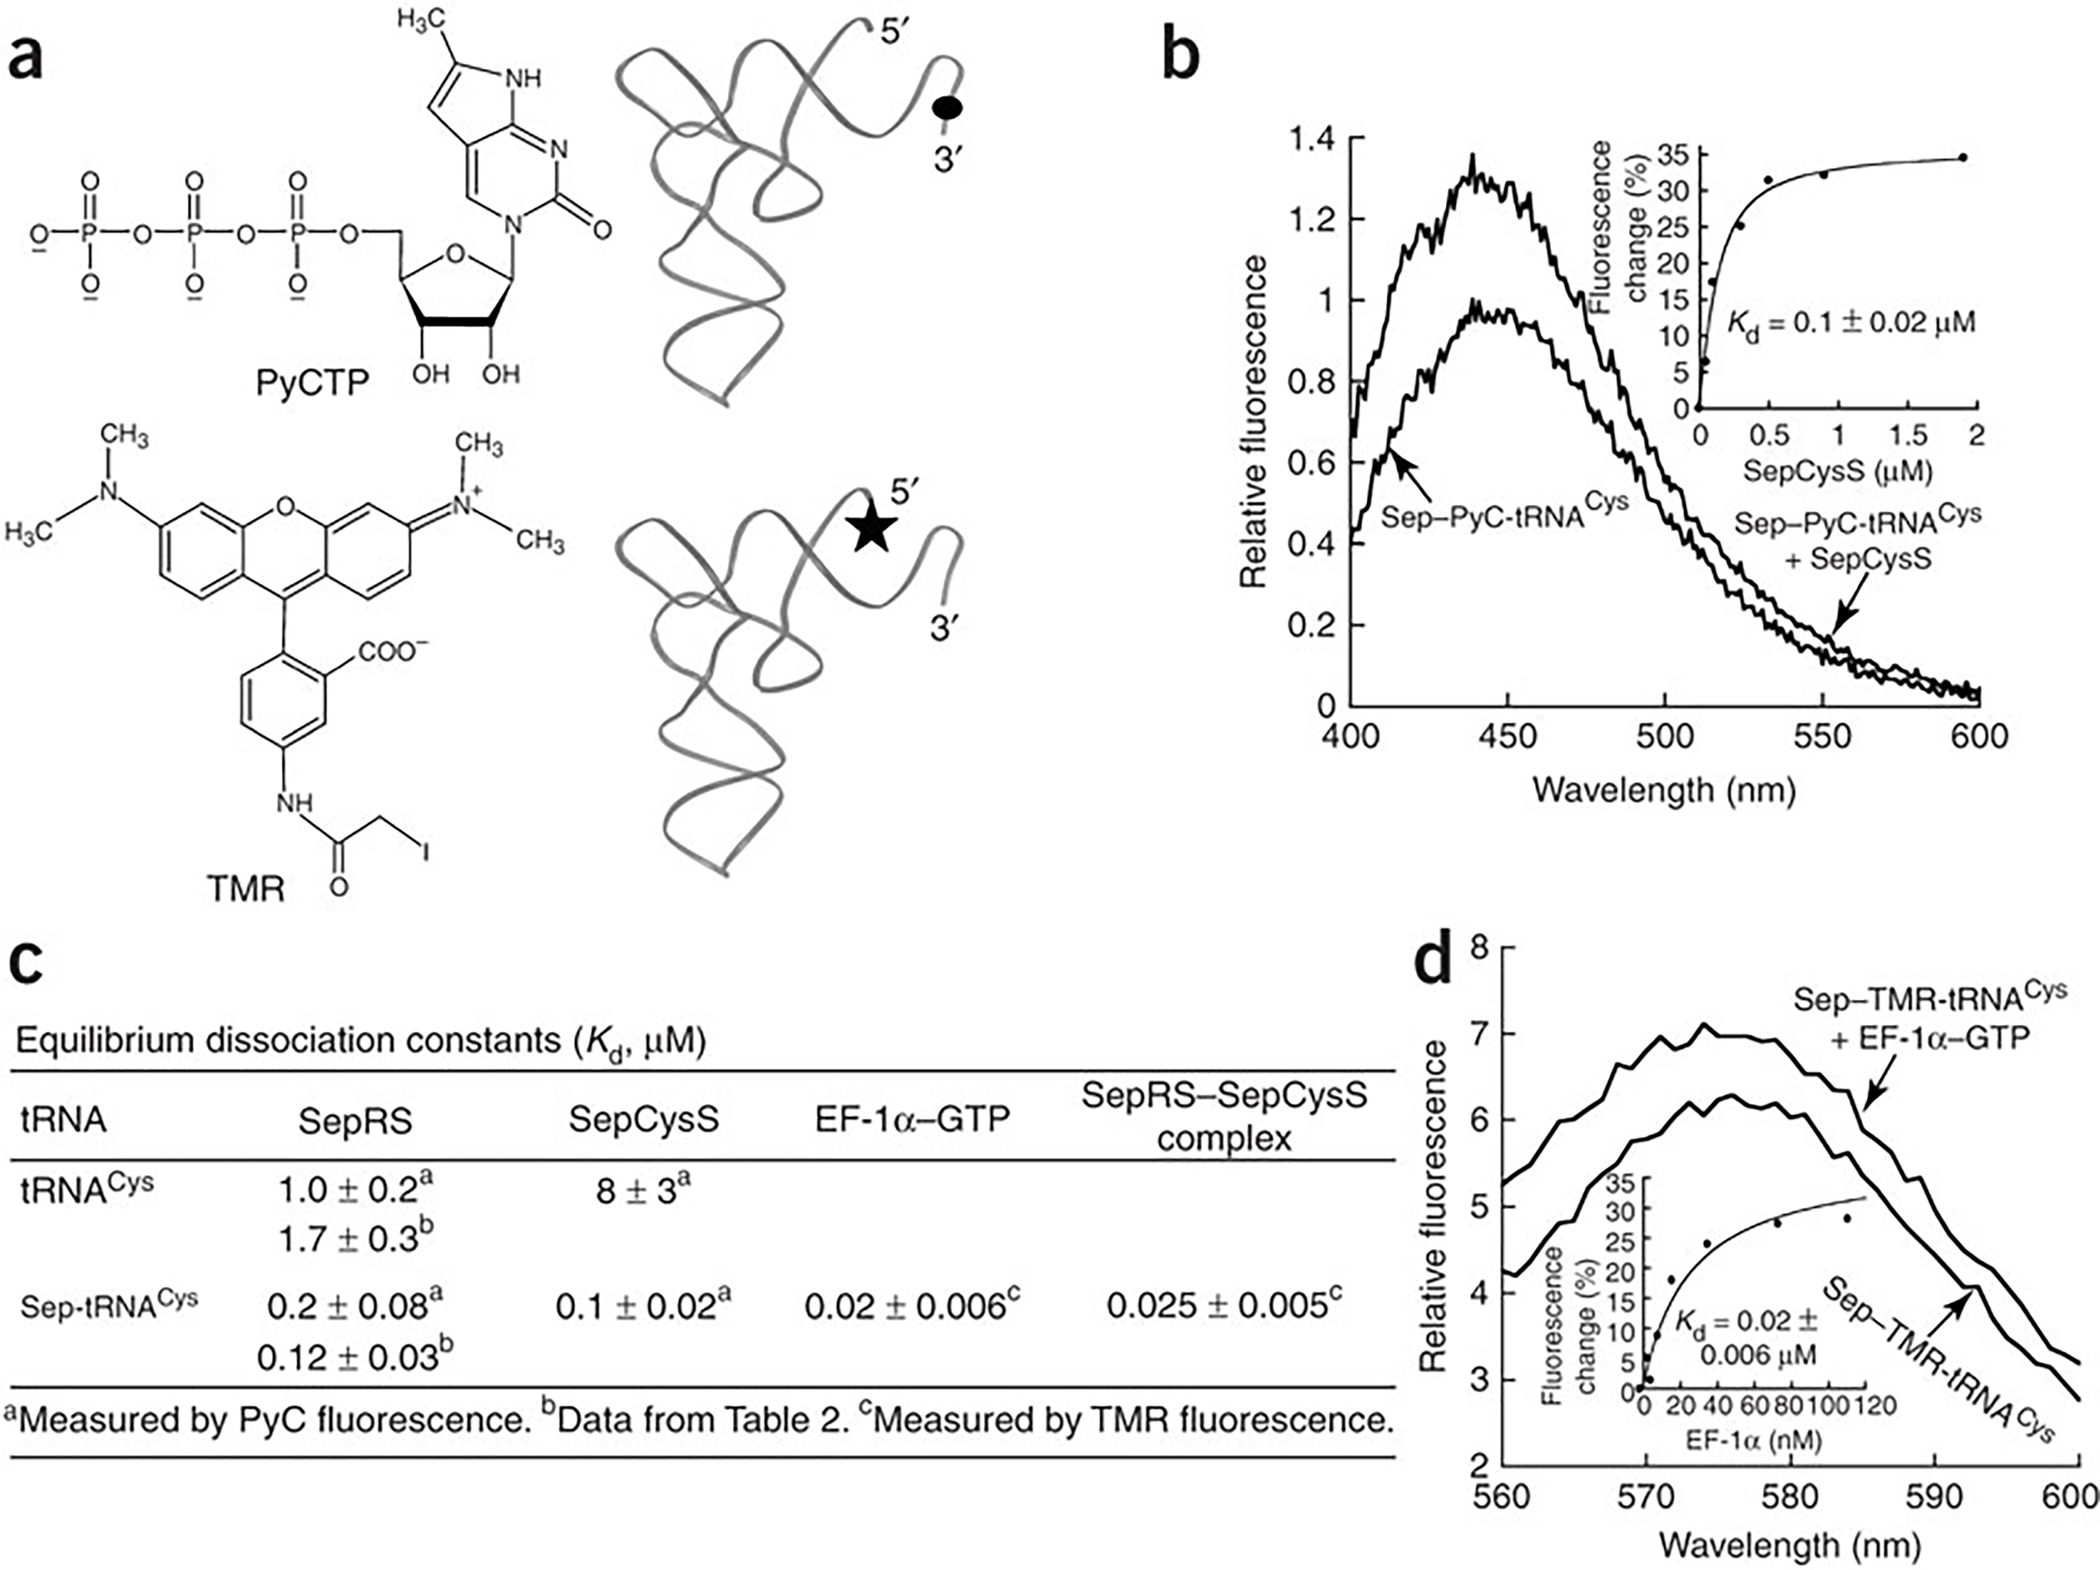
Binding of Sep-tRNACys to SepCysS and EF-1α-GTP. (a) Structures of PyCTP and TMR and their incorporation to the 3’ and 5’ ends of tRNA, respectively. (b) Fluorescence emission spectra of PyC-labeled Sep-tRNACys (0.1 μM) in the absence or presence of M. jannaschii SepCysS (0.9 μM). Inset: replot of the PyC fluorescence change vs SepCysS concentration fit to a quadratic equation. (c) Dissociation constants of tRNACys and Sep-tRNACys for SepRS, SepCysS, EF-1α and the SepRS–SepCysS complex. (d) Fluorescence emission spectra of TMR-labeled Sep-tRNACys (0.2 μM) in the absence or presence of M. jannaschii EF-1α (0.18 μM). Inset: replot of the TMR fluorescence change vs EF-1α concentration fit to a hyperbolic equation. The term ± refers to standard deviation.