
Figure 5.
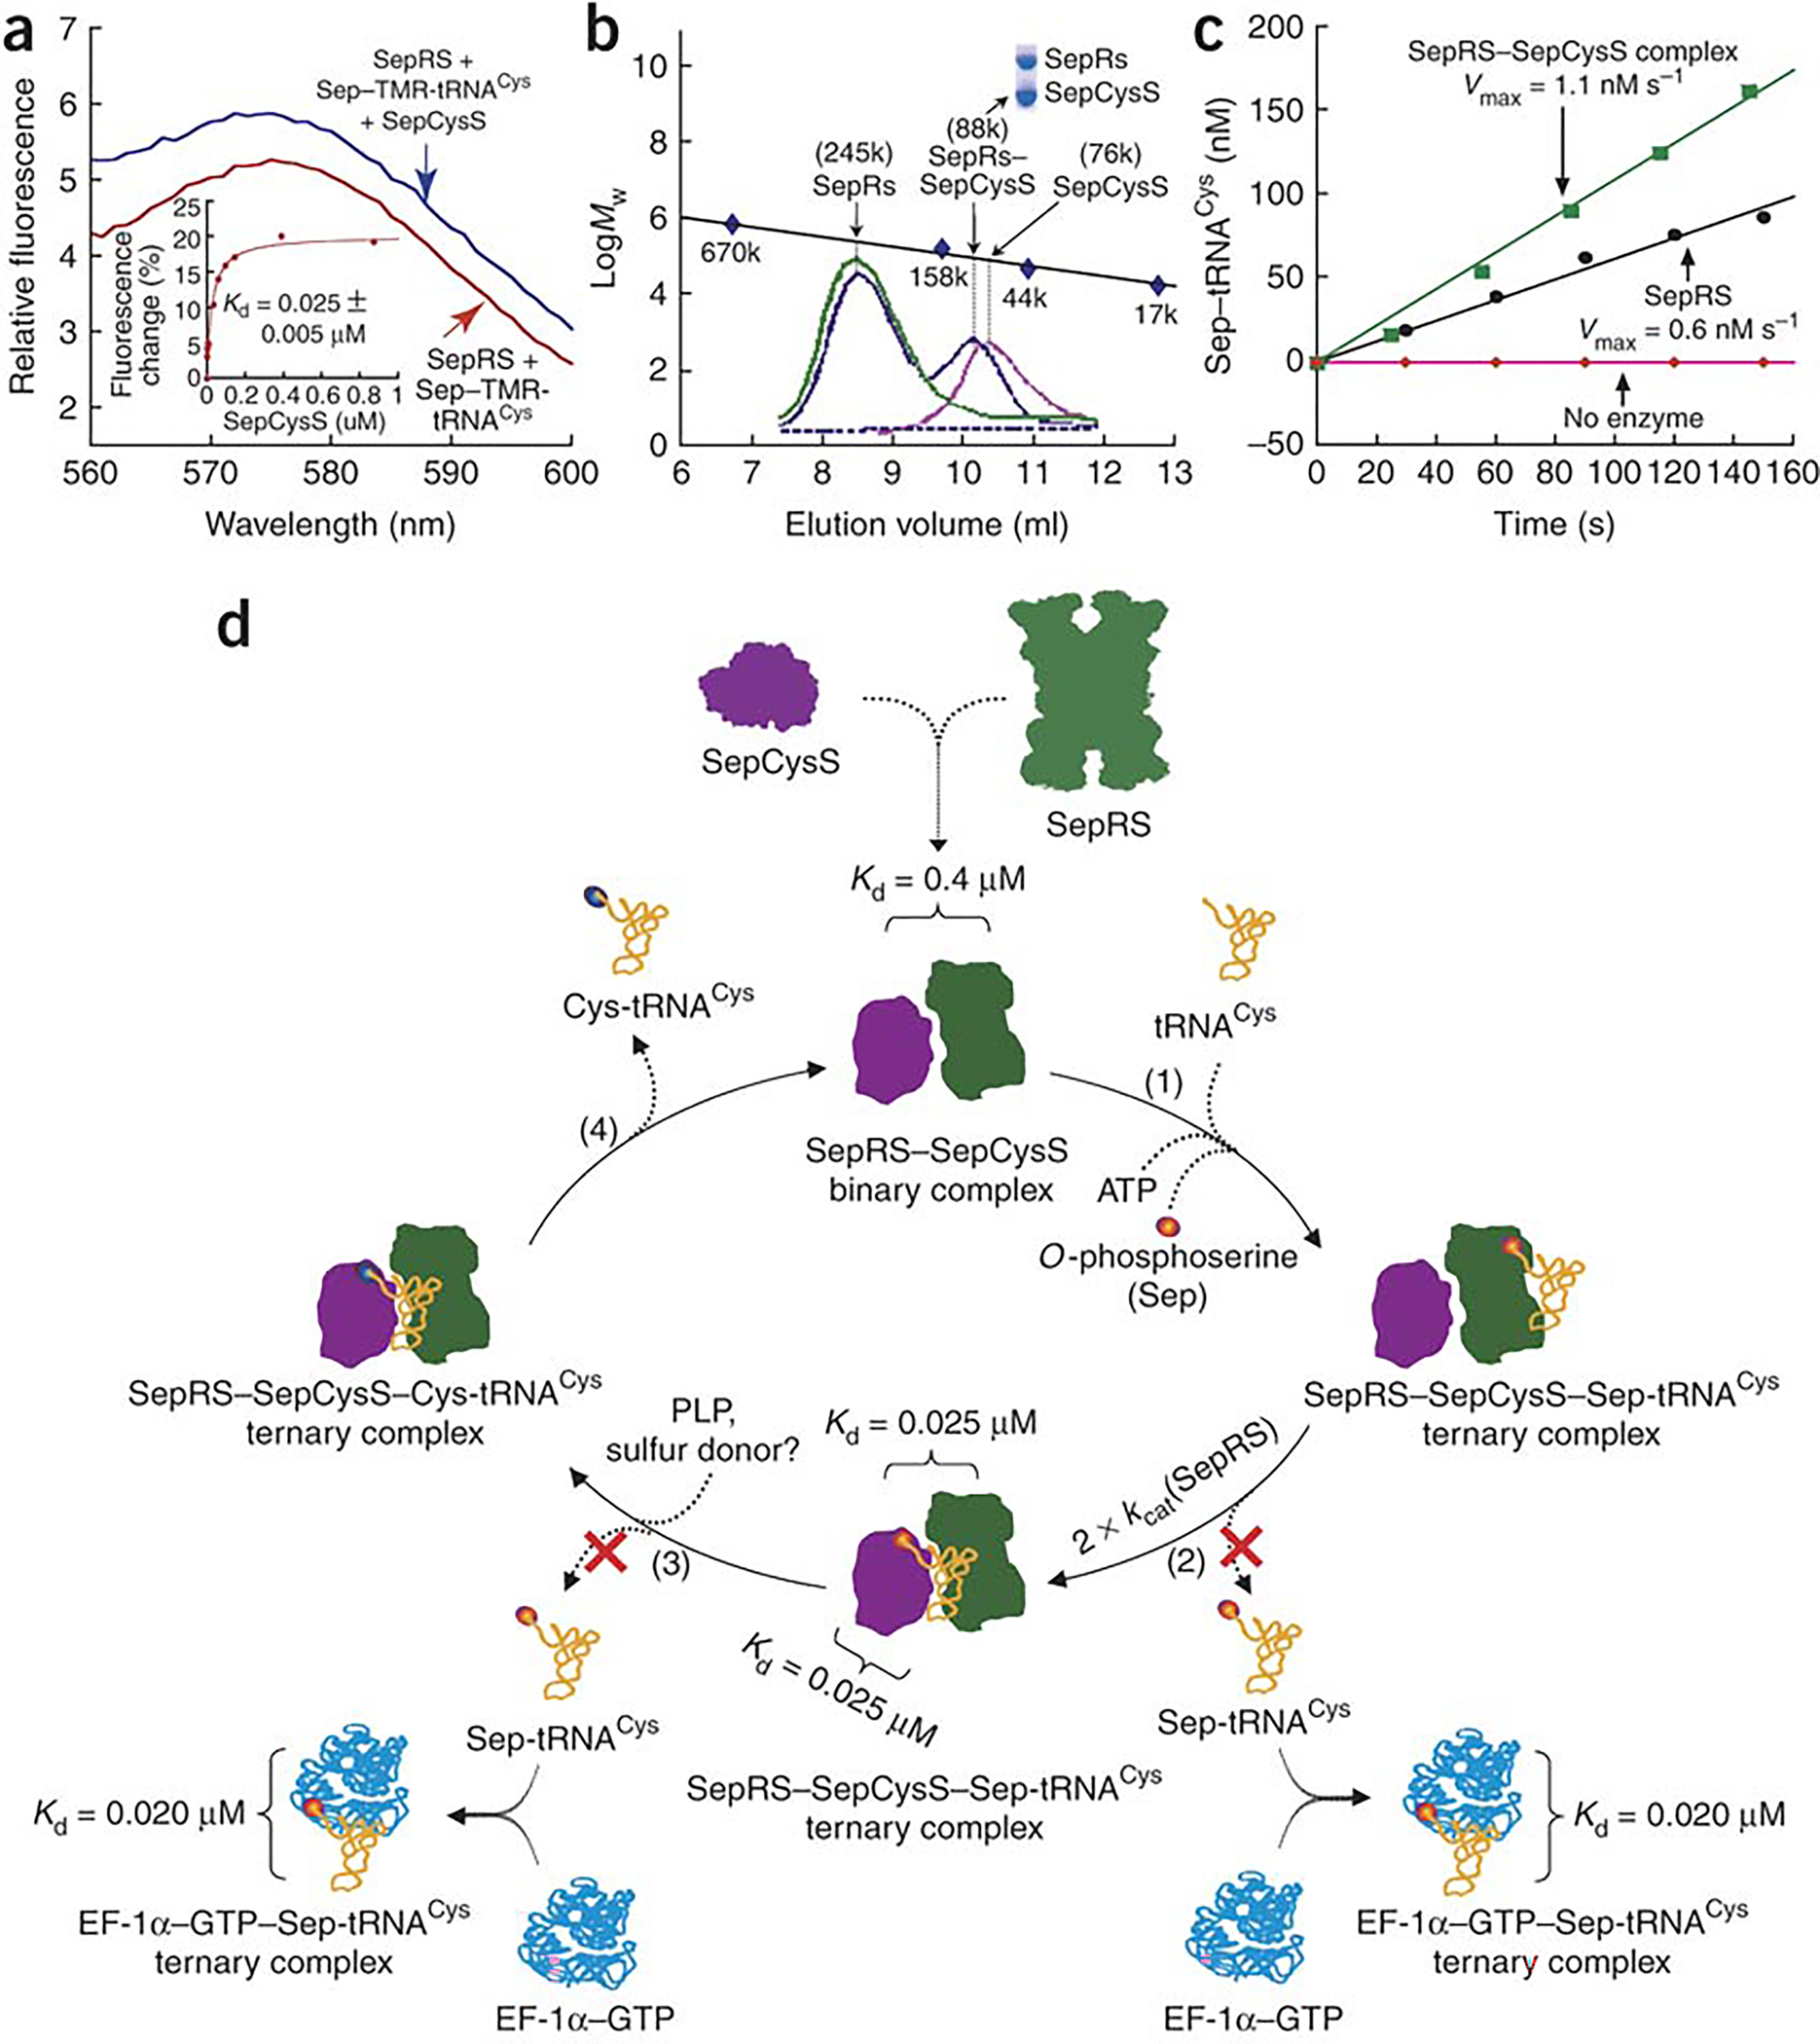
Binding of Sep-tRNACys to the SepRS–SepCysS complex. (a) Fluorescence emission spectra of TMR-labeled Sep-tRNACys (0.2 μM) with saturating SepRS (5 μM) in the absence or presence of SepCysS (0.03 μM). Inset: replot of the TMR fluorescence change vs SepCysS concentration fit to a hyperbolic equation. (b) Gel filtration of SepRS alone (green), SepCysS alone (pink), and the SepRS-SepCysS complex (blue). Mw markers were thyroglobulin (670 kDa), bovine γ-globulin (158 kDa), chicken ovalbumin (44 kDa), and equine myoglobulin (17 kDa). (c) Aminoacylation of m1G37-M. jannaschii tRNACys by SepRS alone (5 nM from fraction 8.5) and by SepRS in the complex (5 nM from fraction 10.3). Inset: SDS-PAGE analysis of the SepRS–SepCysS complex (from fraction 10.3). (d) A scheme showing the pathway of synthesizing and sequestering Sep-tRNACys by the SepRS–SepCysS binary complex for conversion to Cys-tRNACys. The term ± refers to standard deviation.