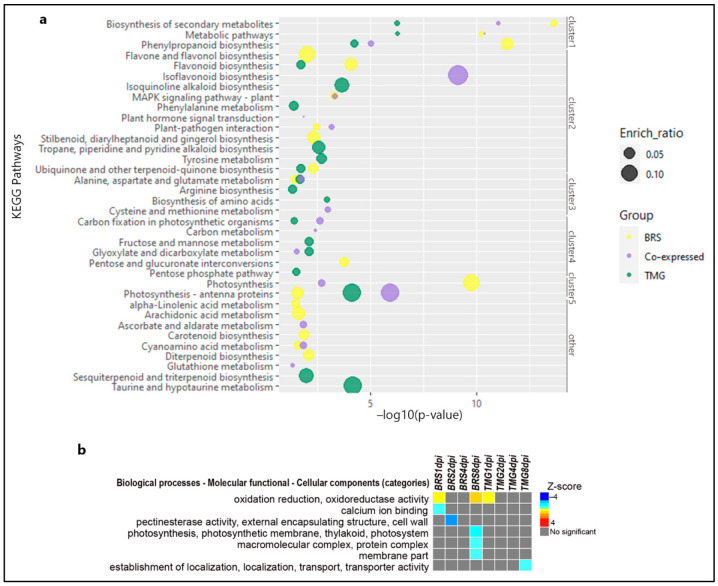
Figure 2.
General KEGG pathways and GO enrichment of DEGs. Bubble plot of significant enriched KEGG pathways in BRS, TMG, and co-expressed DEGs under RLN infection. The enrich-ratio is represented by the size of each bubble as the pathway enrichment level, as well as their level of significance based on −log10(p-value) in the x-axis (a). PAGE results showing up- or down-regulated gene ontology categories in soybean moderately resistant and susceptible genotypes during the four time-points of RLN infection. The statistical significance is inferred using a Z-score value. As a two-tailed test, the Z-score can be either positive or negative. Either the term has a positive Z-score and the fold-change mean of all associated genes is upregulated, or the term has a negative Z-score and the fold-change mean is downregulated [36] (b).

