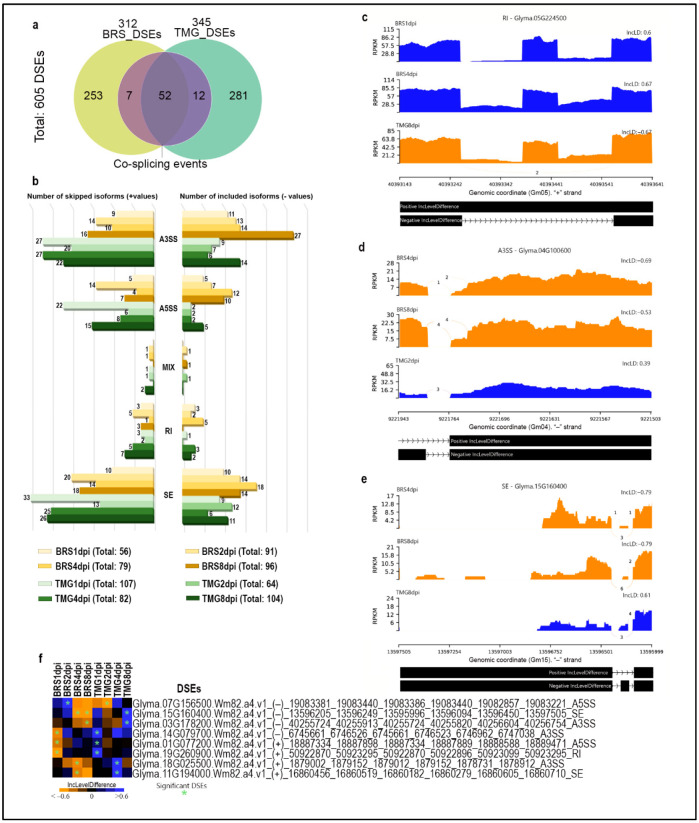
Figure 4.
Soybean alternative splicing events landscapes in response to RLN. Venn diagram showing unique and shared differentially splicing events (DSEs) in BRS and TMG under RLN infection (a). Numbers of skipping and inclusion isoforms of splicing events in BRS and TMG in response to RLN at 1, 2, 4, and 8 dpi (b). Sashimi-plot of differential splicing of retained intron (c), 3′untranslated regions (d), and skipped exons(e). Heatmap showing the impact of RLN infection on 8 DSEs that presented inverted profiles between genotypes (f).

