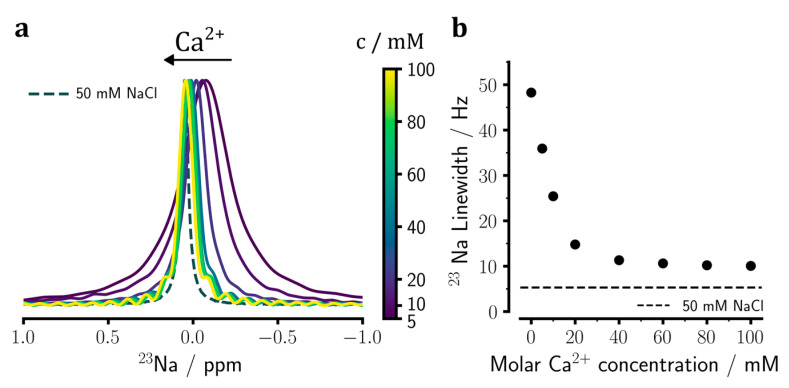
Figure 2.
23Na NMR spectral changes of sodium heparin caused by the addition of Ca2+ ions and the consequent release of sodium ions from heparin. (a) Upon titration of sodium heparin with 0 to 100 mM CaCl2, the 23Na chemical shift gets narrower and moves downfield towards the chemical shift of the reference NaCl sample (see Figure 1). (b) Changes in the 23Na signal linewidth in dependence of added Ca2+ ion concentration, showing a monotonic decrease approaching a value slightly larger than the linewidth of the reference NaCl sample (represented by the dashed line). The spectra shown in (a) are re-scaled according to their peak intensities. The error bars in (b) are comparable in size to the symbols and, therefore, barely visible.

