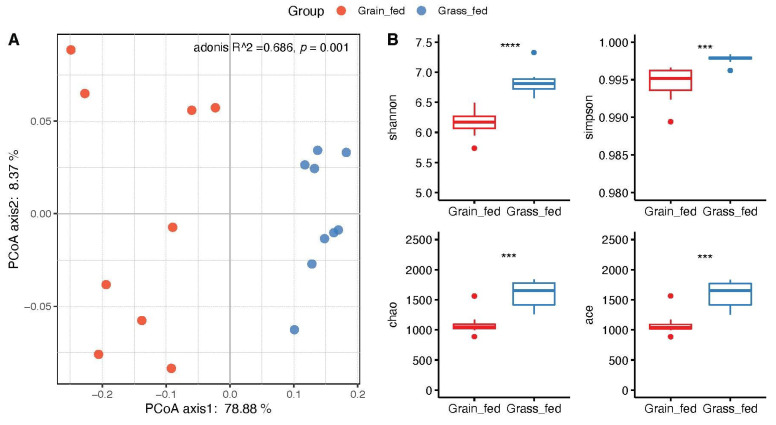
Figure 2.
Community diversity analysis of grass-fed and grain-fed rumen microbiome. (A) Principal Component Analysis (PCoA) based on Bray–Curtis dissimilarity matrix. (B) Alpha diversity indices of bacterial communities between the two groups, including Shannon, Simpson, Chao1 (chao), and Abundance-based Coverage Estimator (ace). **** p < 0.001, *** p < 0.01.

