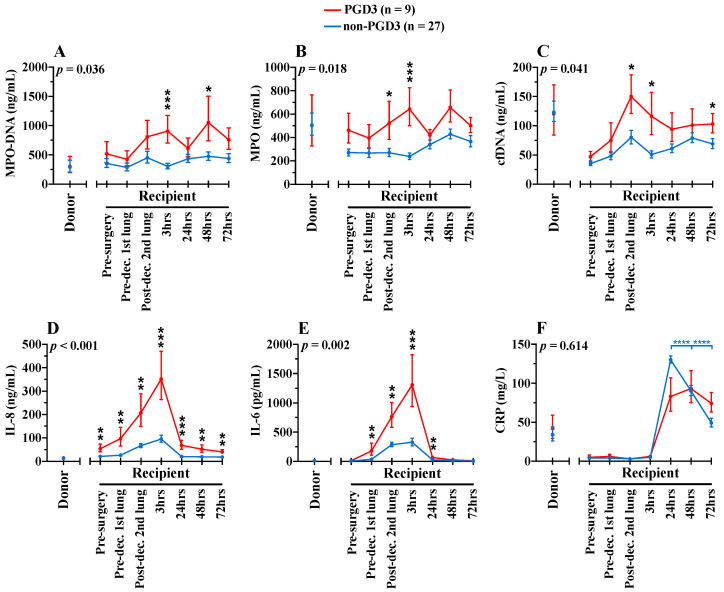
Figure 2.
Pre-, intra- and postoperative serum levels of NETosis (A–C) and inflammatory (D–F) bi-omarkers in donors (n = 25) and recipients (n = 36). Blue lines show biomarkers in non-PGD3 recipients (n = 27) and red lines in PGD3 recipients (n = 9) (Mixed-method analyses). The 95% confidence intervals are represented with bars. p values represent the global inter-group comparisons over time. Significant time-point differences are illustrated with asterisks (*). * p < 0.05, ** p < 0.01, *** p < 0.001 and **** p < 0.0001.

