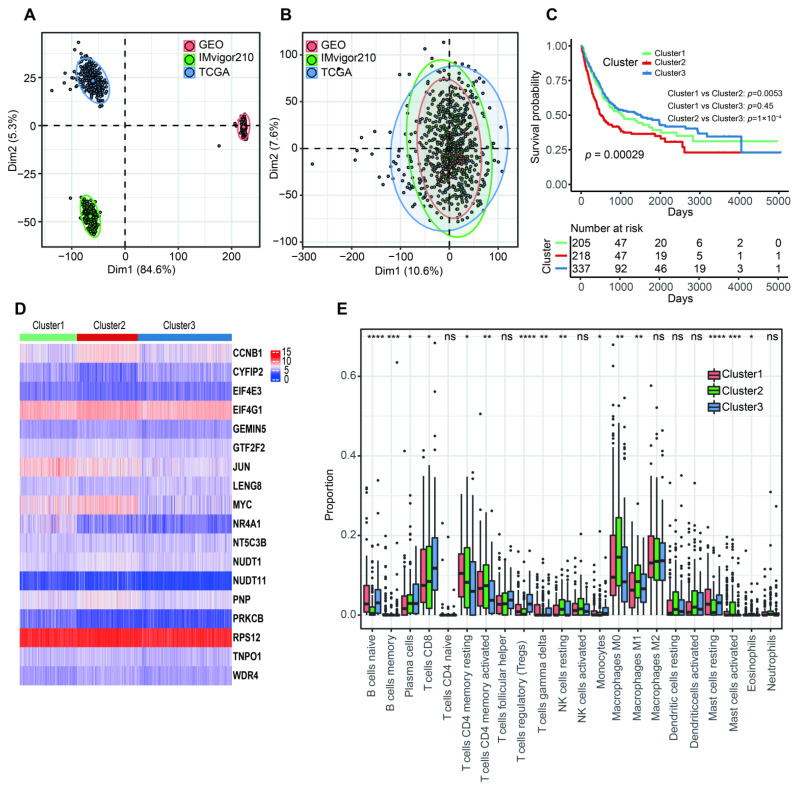
Figure 2.
The characteristics of three m7G-related clusters. (A) Principal component analysis for the common gene profiles before combination of TCGA-BLCA, GSE13507 and IMvigor210 cohorts. (B) Principal component analysis for the common gene profiles after combination of TCGA-BLCA, GSE13507 and IMvigor210 cohorts. (C) The Kaplan–Meier survival analysis of OS among three m7G-related clusters. (D) The heatmap for distribution of 18 m7G-related genes among three m7G-related clusters. (E) The abundance of 22 tumor-infiltrating immune cells in three m7G-related clusters. Data in (E) were analyzed by Kruskal–Wallis test; ns, no significance; * p < 0.05, ** p < 0.01, *** p < 0.001 and **** p < 0.0001.

