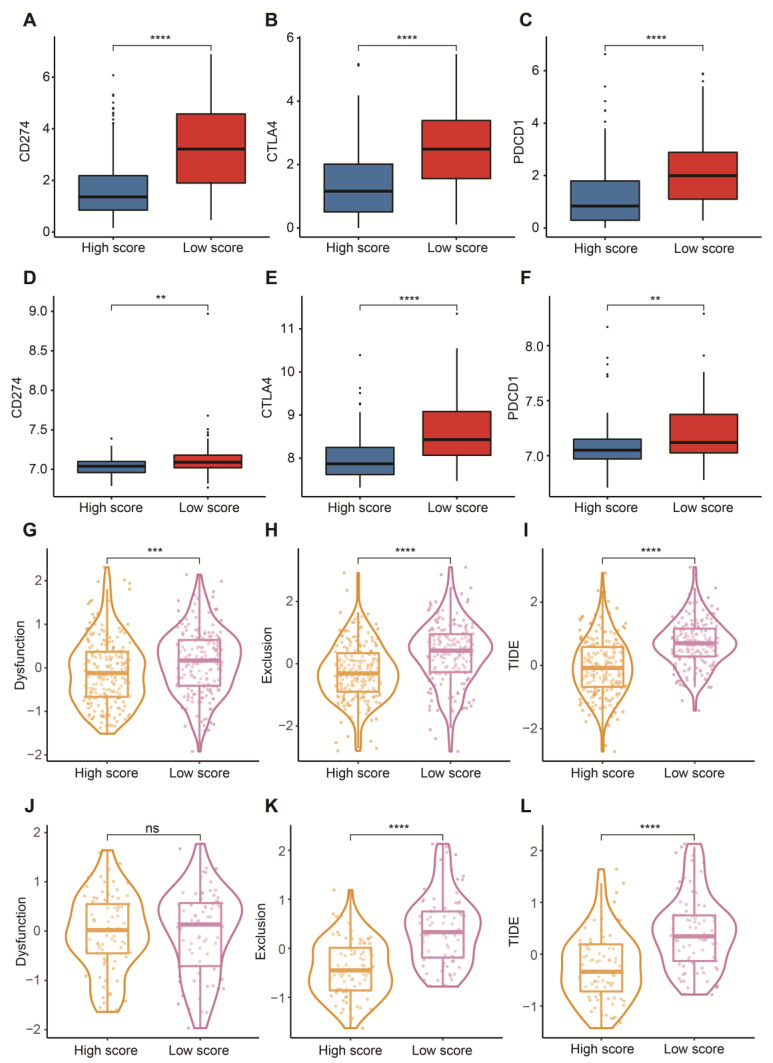
Figure 7.
Prediction of immunotherapy. (A) Box plots of CD274 between high- and low-score groups in the TCGA-BLCA dataset. (B) Box plots of CTLA4 between high- and low-score groups in the TCGA-BLCA dataset. (C) Box plots of PDCD1 between high- and low-score groups in the TCGA-BLCA dataset. (D) Box plots of CD274 between high- and low-score groups in the GSE13507 dataset. (E) Box plots of CTLA4 between high- and low-score groups in the GSE13507 dataset. (F) Box plots of PDCD1 between high- and low-score groups in the GSE13507 dataset. (G) Distribution of dysfunction scores between high- and low-score groups in the TCGA-BLCA dataset. (H) Distribution of exclusion scores between high- and low-score groups in the TCGA-BLCA dataset. (I) Distribution of TIDE scores between high- and low-score groups in the TCGA-BLCA dataset. (J) Distribution of dysfunction scores between high- and low-score groups in the GSE13507 dataset. (K) Distribution of exclusion scores between high- and low-score groups in the GSE13507 dataset. (L) Distribution of TIDE scores between high- and low-score groups in the GSE13507 dataset. Data in A–L were analyzed by Wilcoxon test; ns, no significance; ** p < 0.01, *** p < 0.001 and **** p < 0.0001.

