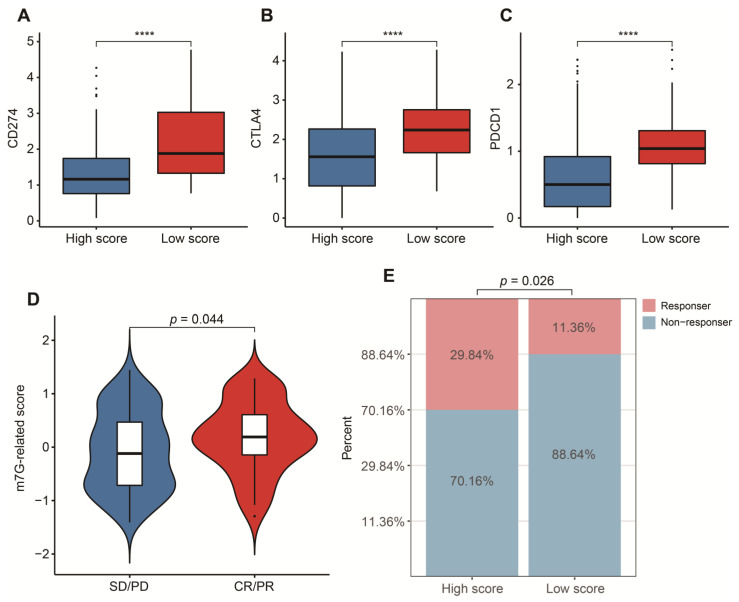
Figure 8.
Validation in a real immunotherapy cohort. (A) Box plots of CD274 between high- and low-score groups. (B) Box plots of CTLA4 between high- and low-score groups. (C) Box plots of PDCD1 between high- and low-score groups. (D) Distribution of m7G-related scores between responders and non-responders. (E) Comparison of overall response rate between high- and low-score groups. Data in (A–C) were analyzed by Wilcoxon test; **** p < 0.0001.

