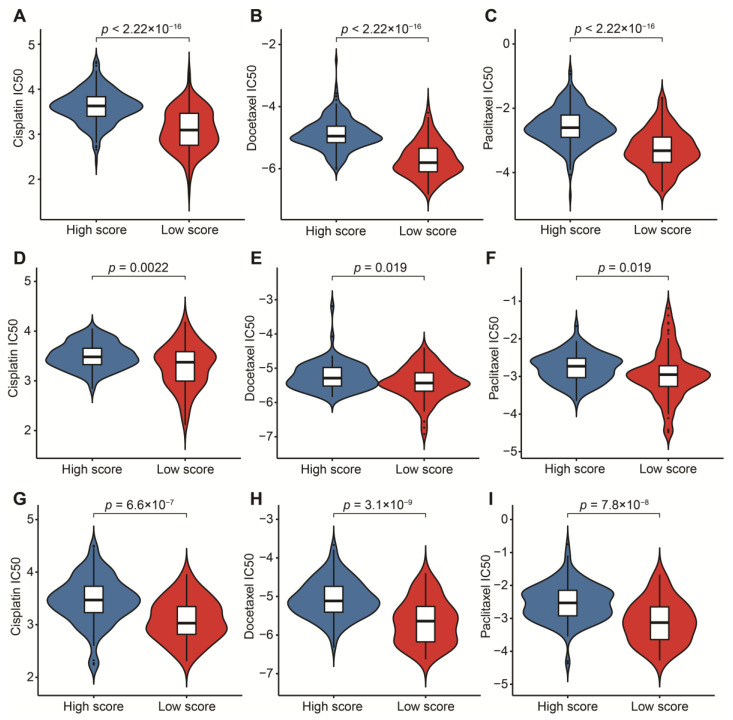
Figure 9.
Prediction of sensitivity to three chemotherapeutic drugs. (A) Comparison of cisplatin IC50 between high- and low-score groups in the TCGA-BLCA dataset. (B) Comparison of docetaxel IC50 between high- and low-score groups in the TCGA-BLCA dataset. (C) Comparison of paclitaxel IC50 between high- and low-score groups in the TCGA-BLCA dataset. (D) Comparison of cisplatin IC50 between high- and low-score groups in the GSE13507 dataset. (E) Comparison of docetaxel IC50 between high- and low-score groups in the GSE13507 dataset. (F) Comparison of paclitaxel IC50 between high- and low-score groups in the GSE13507 dataset. (G) Comparison of cisplatin IC50 between high- and low-score groups in the IMvigor210 cohort. (H) Comparison of docetaxel IC50 between high- and low-score groups in the IMvigor210 cohort. (I) Comparison of paclitaxel IC50 between high- and low-score groups in the IMvigor210 cohort.

