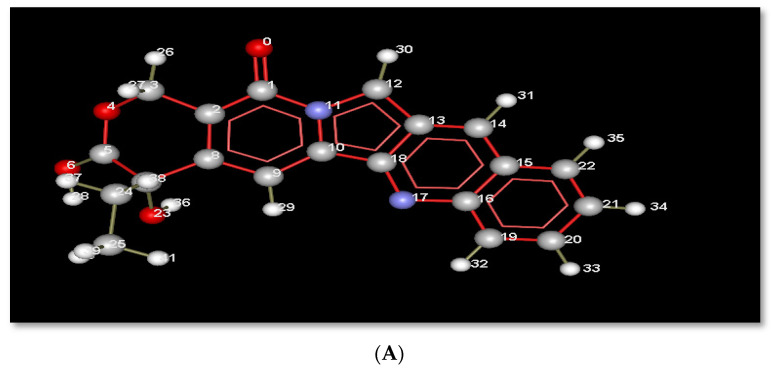
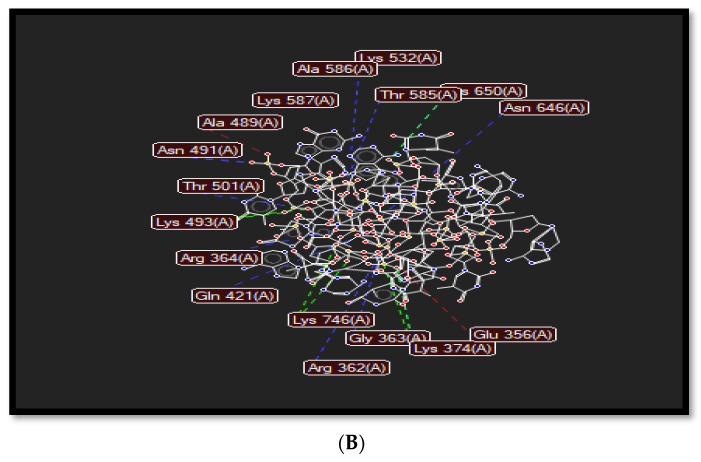
Figure 3.
(A): Index number of acridine displayed in molecular interactions. (B) Representation of the molecular interactions of the 1t8i crystal structure, where blue dashed lines refer to hydrogen bond interactions, green dashed lines display electrostatic interactions and red lines show steric interactions.


