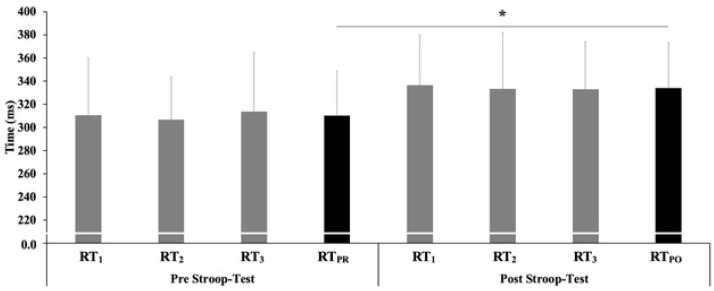
Figure 4.
Pre-/post-Stroop test reaction time (single tests RT1,2,3, in grey color). Average (in black color) RTPR pre and RTPO post stroop-test comparison (*—p < 0.05). RT1: Reaction time test 1 of 3; RT2: Reaction time test 2 of 3; RT3: Reaction time test 3 of 3; RTPR: Reaction media in the three tests in pre-test; RTPO: Reaction media in the three tests in post-test.

