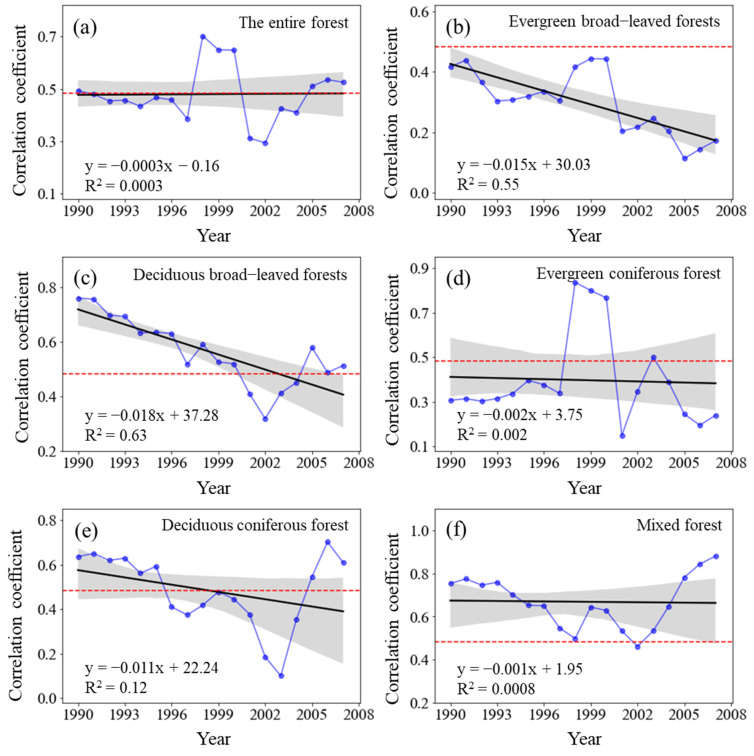
Figure 8.
Variations in the sliding correlation coefficients between NPP and total solar radiation across forest types. Statistically significant partial correlation coefficients are indicated as dotted lines (p < 0.05). The black lines represent the interannual change trend in partial correlation coefficients. Shading denotes 95% prediction intervals.

