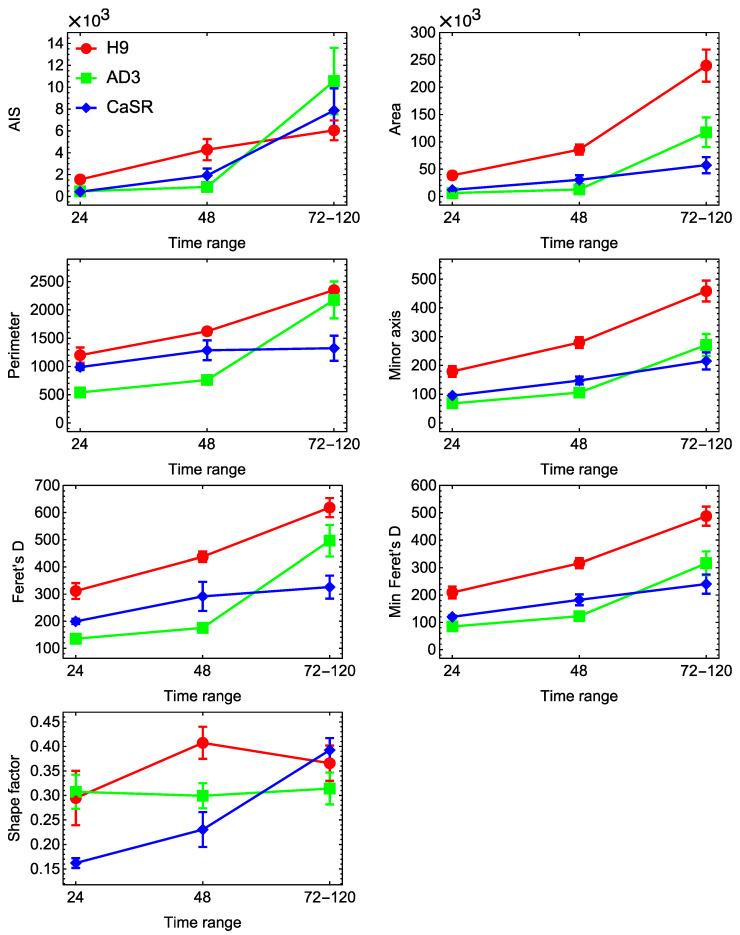
Figure 3.
Dynamics of morphological parameters for colonies from three cell lines. The values of seven parameters from Table 1 were measured for all colonies from H9 (red), hiPSC AD3 (green), and hiPSC CaSR (blue) lines and all passages, at 24 h, 48 h, and 72–120 h. Mean values across processed colonies at each time point are shown, with the standard errors of the mean (SEMs) as the error bars. Late time points are grouped into one range. Shape factor, dimensionless parameter; AIS and Area, µm2; all other parameters, µm.

