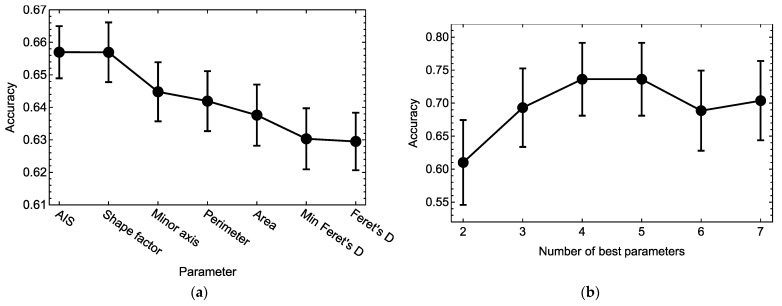
Figure 6.
Mean accuracy ± SEM of the phenotype classification models based on different subsets of colony morphological parameters as predictors: (a) Importance measure for each parameter calculated as the mean cross-validation accuracy across the models containing this parameter in all possible combinations with all other parameters. Higher values of this measure for a parameter indicated that models containing this parameter as a predictor better recognized the colony phenotype. (b) Mean cross-validation accuracy of the models containing a given number of the best parameters from (a). Combinations of best parameters in (b): 2, AIS and Shape factor; 3, AIS, Shape factor and Minor axis; 4, AIS, Shape factor, Minor axis, and Perimeter; 5, AIS, Shape factor, Minor axis, Perimeter, and Area; 6, AIS, Shape factor, Minor axis, Perimeter, Area, and Min Feret’s D; 7, all parameters. The maximum accuracy in (b) was already achieved with four parameters, so the classification model with the four best parameters used as predictors provided a compromise between simplicity and prediction accuracy.

