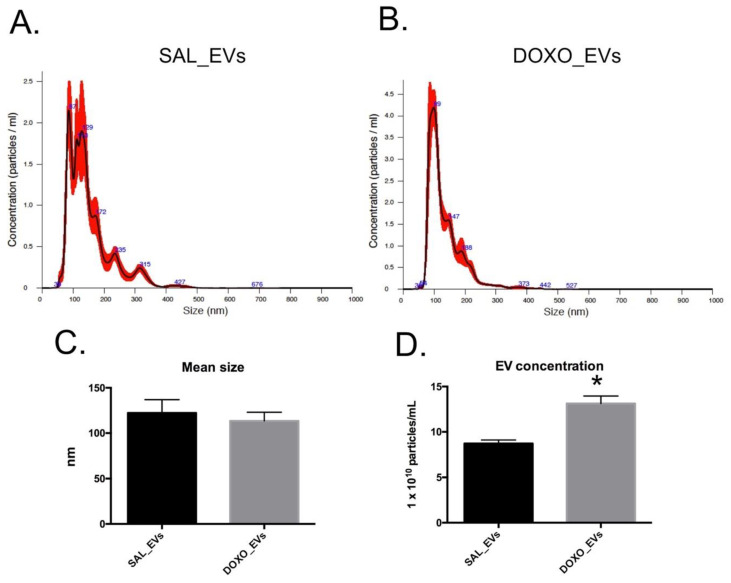
Figure 3.
Representative graphs of size distributions of SAL_EVs (A) and DOXO_EVs (B) size distribution. Blue line represents the averaged data, whereas red line represents the SE. The mean size ± SE of SAL_EVs and DOXO_EVs (C)The average EV concentration ± SE of SAL_EVs (n = 5) and DOXO_EVs (n = 5) (D). * p < 0.05.

