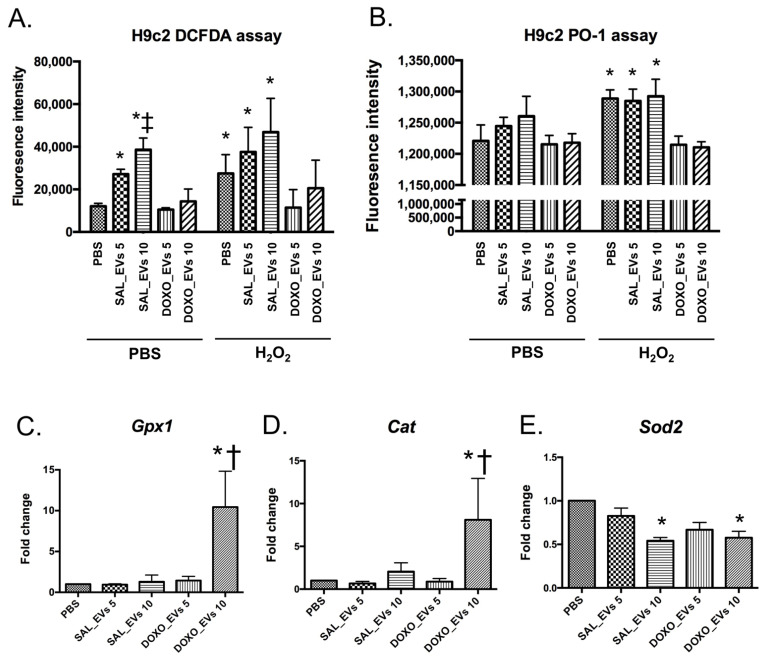
Figure 4.
Levels of ROS production measured by DCFDA assay (A) and PO-1 assay (B) in H9c2 cells pre-incubated with SAL_EVs or DOXO_EVs for 24 h followed by PBS or 100 μM H2O2 treatment for 10 min; * p < 0.05 vs. no EV, no H2O2 treated control (PBS), ‡ p < 0.05 vs. SAL_EVs 5 Levels of Gpx1 (C), Cat (D) and Sod2 (E) gene expression in H9c2 cells incubated with SAL_EVs or DOXO_EVs for 24 h; SAL_EVs 5 = H9c2 cells pre-incubated with SAL_EVs 5 × 10⁹ particles/mL; SAL_EVs 10 = H9c2 cells pre-incubated with SAL_EVs 10 × 109 particles/mL; DOXO_EVs 5 = H9c2 cells pre-incubated with DOXO_EVs 5 × 10⁹ particles/mL; DOXO_EVs 10 = H9c2 cells pre-incubated with DOXO_EVs 10 × 109 particles/mL; * p < 0.05 vs EVs from the same group at concentration 5 × 10⁹ particles/mL, † p < 0.05 vs SAL_EVs 10 × 109 particles/mL.

