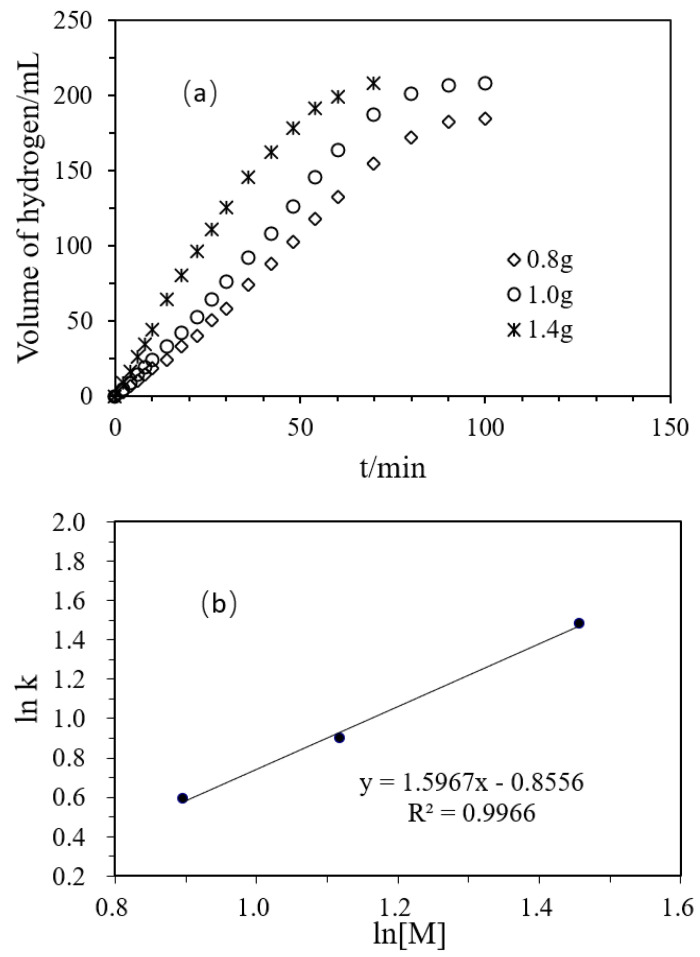
Figure 4.
(a) Volume of hydrogen versus time plots for the hydrolysis of DMAB catalyzed by Ni/Pd nanoclusters (Ni/Pd = 20/1) with different masses of the hybrid catalyst at 50 °C; (b) Plot of the initial hydrogen production rate (k, in mL min−1) versus the total concentration of Pd and Ni (in logarithmic scale, y = 1.5967x − 0.8556).

