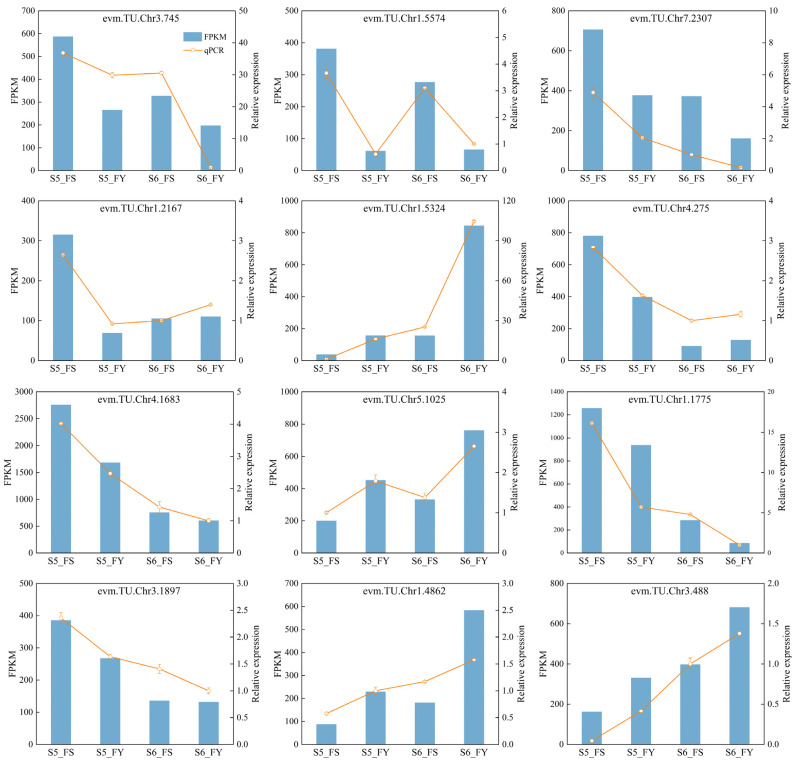
Figure 8.
Real-time quantitative PCR validation profiles of twelve randomly selected genes from FS and FY fruits. The vertical bar indicates the standard error. The Y-axis on the left is the gene FPKM from RNA-seq (blue histogram). The y-axis on the right indicates the gene relative expression levels from the corresponding qRT-PCR analysis (orange line).

