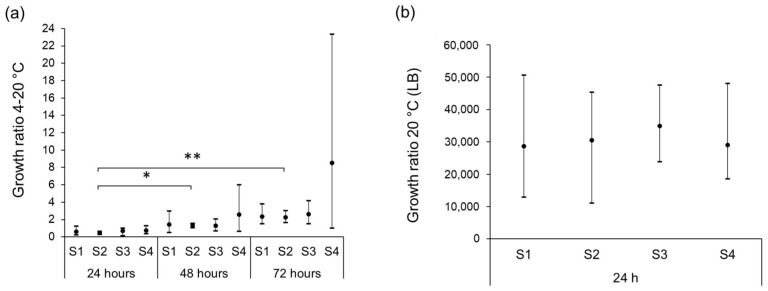
Figure 4.
Chart showing the minimum, maximum, and average of growth ratios for STEC isolates S1, S2, S3, and S4 in unpasteurized milk at 4 °C under a temperature abuse scheme of 90 min at 20 °C every 24 h (a) and at 20 °C in LB-broth (b). Asterisks represent statistical differences from pairwise comparisons determined using two-tailed paired Student’s t tests (* p < 0.01; ** p < 0.05).

