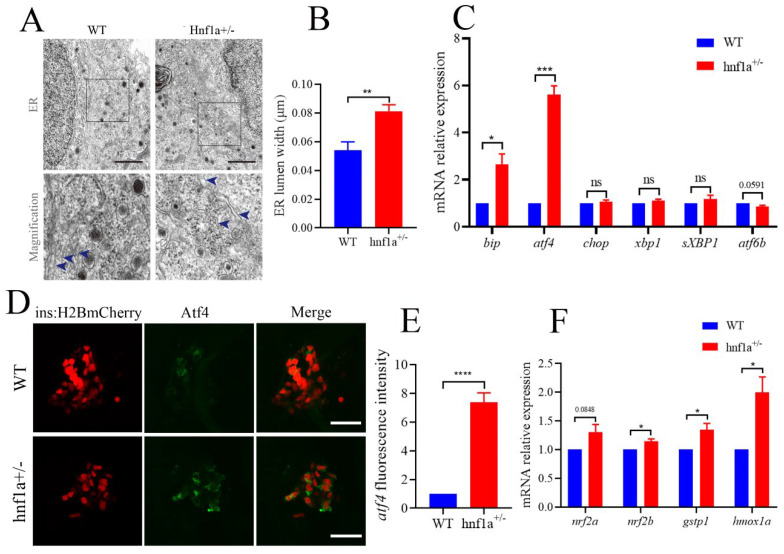
Figure 3.
The β cells of hnf1a+/− zebrafish displayed ER stress. (A) Transmission electron microscopy analysis of ER in WT and hnf1a+/− β cells at 6 dpf zebrafish. Blue arrows indicated magnified ER morphology. Scale bar: 3 μm. (B) Quantification of ER lumen width for WT and hnf1a+/− β cells. At least 15 different locations of the same cell were measured; n = 3 β cells for each genotype. (C) RT-qPCR analysis of the mRNA expression levels for ER-stress-related marker genes in WT and hnf1a+/− larvae at 6 dpf: bip, atf4, chop, xbp1, sXBP1, and atf6b. (D) Immunofluorescence analysis of WT and hnf1a+/− larvae at 6 dpf with atf4 staining (Green). β cells are indicated by the red fluorescence with Tg(ins:H2BmCherry). Scale bar indicates 20 μm. (E). Quantification of fluorescence intensity for atf4 in WT and hnf1a+/−; n = 3 larvae for each genotype. (F) RT-qPCR analysis of the mRNA expression levels for nrf2a, nrf2b, gstp1, and hmoxla in WT and hnf1a+/− larvae; n = 3 larvae for each genotype. Results are represented as means with standard errors; * p < 0.05, ** p < 0.01, and *** p < 0.001, and **** p < 0.0001. Student’s t-test. All experiments were performed in at least three biological repeats. WT, wild type.

