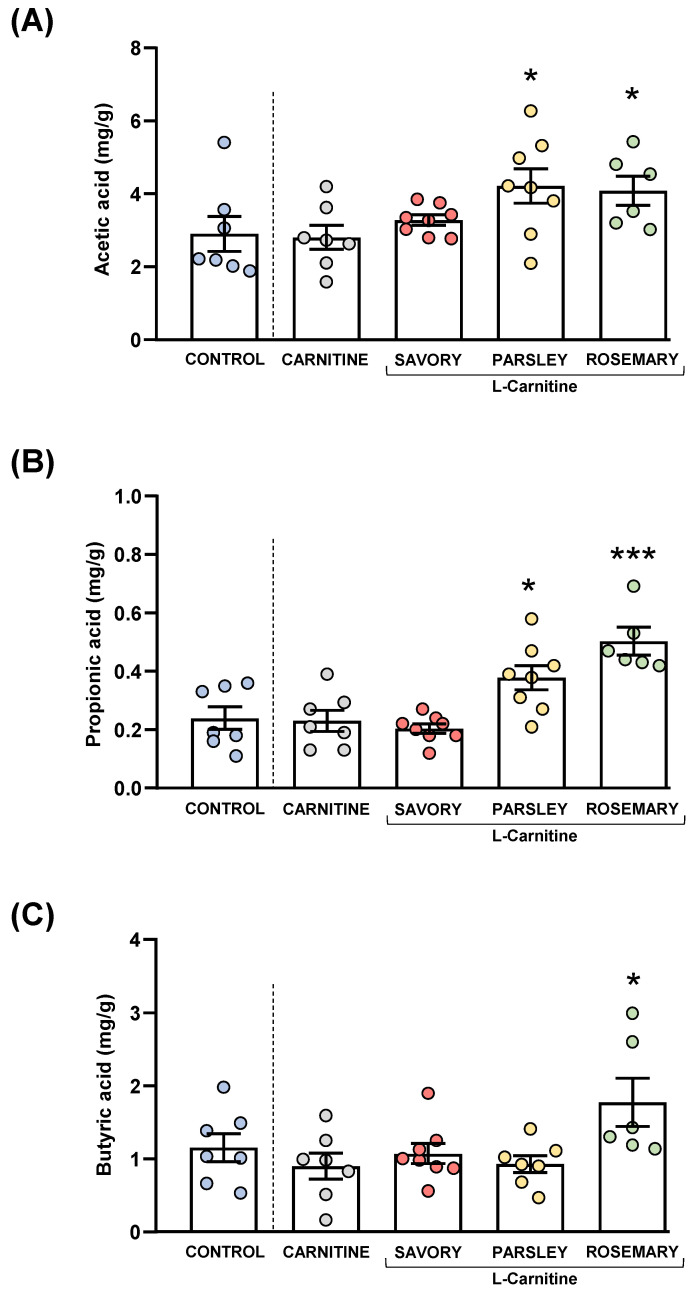
Figure 5.
Fecal levels of SCFA species in mice from the treatment groups. (A) Acetic; (B) Propionic; and (C) Butyric acid levels. Dots are individual values. Bars are means ± SEM of SFCA concentrations (mg g−1). Data from the control and carnitine groups were analyzed using Student’s t test. Data from the carnitine, savory, parsley and rosemary groups were analyzed using one-way ANOVA. (*) p < 0.05 and (***) p < 0.001 denote significant differences compared with the carnitine group.

