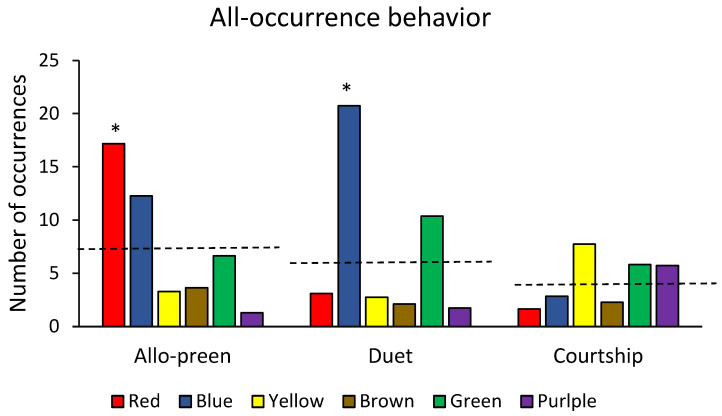
Figure 5.
Frequency of pair-bonding behaviors across 6 mated pairs of Humboldt penguins based on 219 h of Zoo Monitor data. Frequencies were adjusted downwards by a factor of 11 to account for the differences in observation time across the two data collection systems. Dashed lines indicate the expected frequency of behaviors assuming no differences amongst pairs. * = p < 0.05. See text for details.

