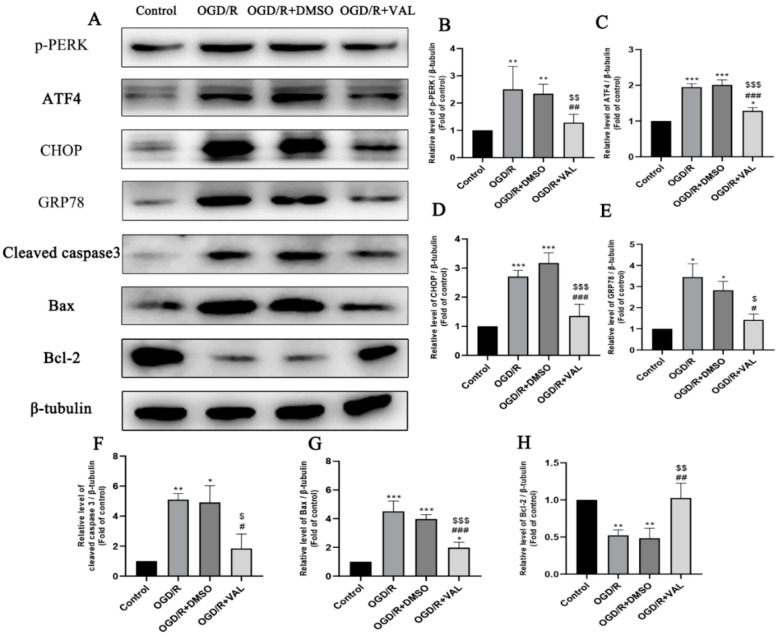
Figure 3.
Effect of valdecoxib on the expression of ER stress-related and apoptosis-related proteins in the OGD/R model. (A) Western blot analysis of p-PERK, ATF4, GRP78, CHOP, cleaved caspase 3, bax and bcl-2 levels in the control, OGD/R, OGD/R+DMSO and OGD/R+VAL groups. (B–H) Quantification of expression levels of p-PERK, ATF4, GRP78, CHOP, cleaved caspase 3, bax and bcl-2 in the control, OGD/R, OGD/R+DMSO and OGD/R+VAL groups using the densitometric analyses of Western blotting. The bar charts show the quantitative data (normalized by β-tubulin) for each protein relative to the control group (assigned a value of 1). Data are represented as the mean ± SD of three independent experiments. One-way ANOVA is used in B to H. * p < 0.05, ** p < 0.01, *** p < 0.001 vs. control group. # p < 0.05, ## p < 0.01, ### p < 0.001 vs. OGD/R group. $ p < 0.05, $$ p < 0.01, $$$ p < 0.001 vs. OGD/R+DMSO group.

