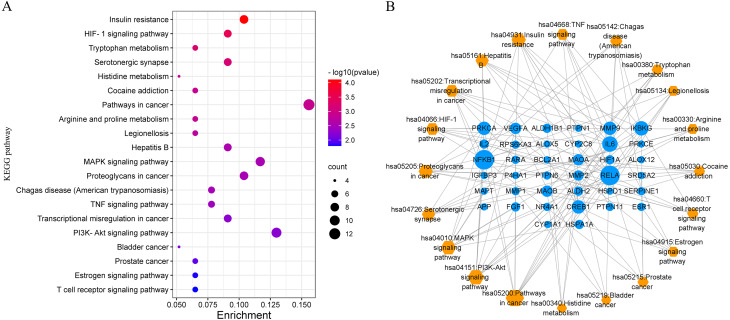
Figure 8. Results of KEGG pathway enrichment analysis based on the targets in the PPI network.
(A) The bubble plot of the top 20 pathway enrichment analysis; (B) target–pathway interaction network suggests the underlying mechanisms of SGXZ decoction for the treatment of NAFLD. Blue circle nodes indicate the targets and orange diamonds represent the pathways. The gray edges link the interaction between the targets and pathways, and the node size is proportional to the degree value.

