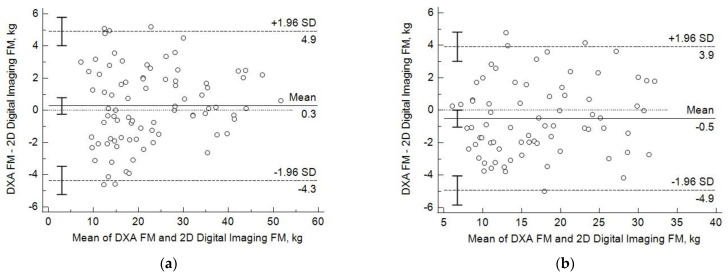
Figure 4.
Bland–Altman plots illustrate the differences between individual dual X-ray absorptiometry (DXA)-measured and two dimensional (2D) digital image-predicted fat mass (FM) values as a function of the mean values of females (a) and males (b). Linear regression line describes the bias and 95% confidence intervals (1.96 SD) indicate the limits of agreement. Bars indicate 95% confidence intervals for mean and LOA values.

