Figure 2.
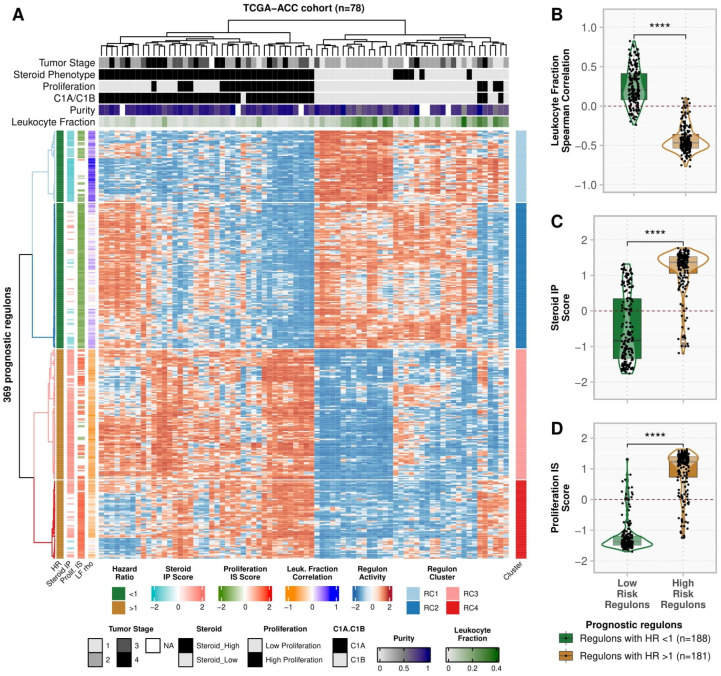
Activity profile of prognostic regulons (n = 369) in TCGA-ACC cohort (n = 78). (A) Heatmap with the activity of the 369 prognostic regulons. Each row represents a regulon, and each column is a sample from the TCGA-ACC cohort. Both were subjected to unsupervised clustering. The upper tracks present the clinical and molecular classification for the samples defined by Zheng et al. (2016) [7] and Thorsson et al. (2018) [14]. The left tracks show the regulon association with the hazard ratio (HR) for overall survival (OS), the Steroid independent of Proliferation (IP) and Proliferation independent of Steroid (IS), and the correlation with the Leukocyte Fraction. The right track presents the regulon clusters defined by Consensus Clustering (Supplementary Figure S3). (B–D) Regulons are grouped into High- and Low-risk categories according to the HR in Multivariate Cox Analysis. Each point represents a regulon, and the contour presents the distribution density of the regulons for each group. The boxplots show the distinction between the groups for (B) the Spearman’s correlation between the leukocyte fraction and the regulon activity, (C) the Steroid IP score, and (D) the Proliferation IS score. **** p ≤ 0.0001 in the two-sided Mann-Whitney-Wilcoxon test.

