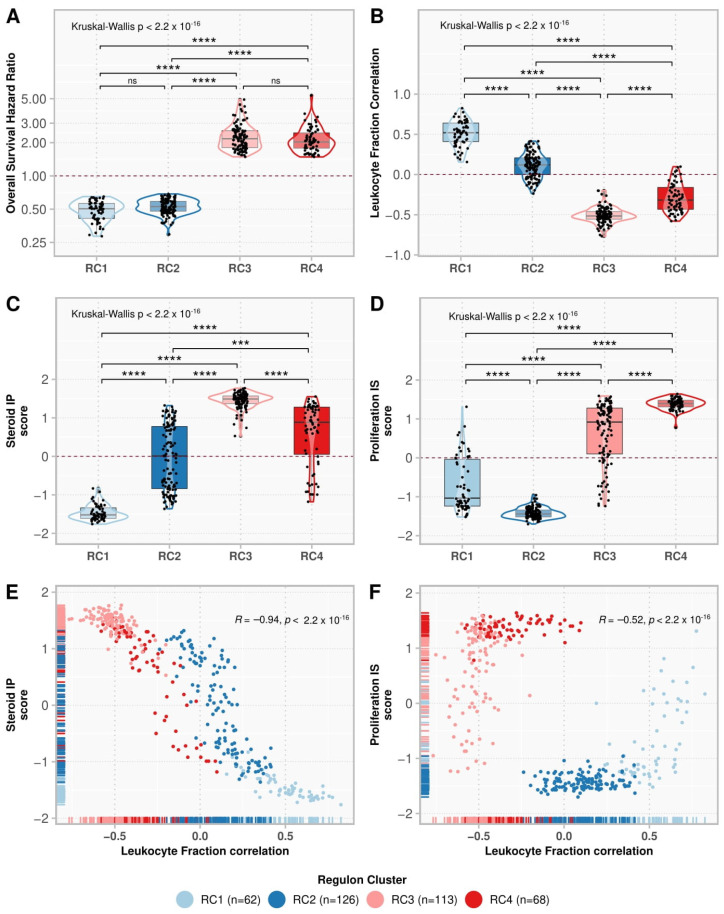
Figure 3.
Comparison of regulon clusters (RC). The boxplots show the regulon distributions in each cluster for the overall survival (OS) hazard ratio (HR) (A), leukocyte fraction correlation (B), Steroid independent of Proliferation (IP) score (C), and Proliferation independent of Steroid (IS) score (D). Each point represents a regulon, and the box’s horizontal lines show the median and the 25–75% percentiles, while the whiskers (vertical lines) cover the 0–25% and 75–100% percentiles. The contour presents the distribution density of the regulons. The results of Kruskal-Wallis and Dunn’s tests for multiple pairwise comparisons of the ranked data are presented on top. Asterisks indicate the significance level as follows: *** p ≤ 0.001, and **** p ≤ 0.0001. Non-significant p-values (p > 0.05) are represented by “ns”. (E,F) show the scatter plot for the leukocyte fraction correlation with the Steroid IP score and Proliferation IS score, respectively. Each point represents a regulon, colored by its respective cluster. The rugs show the distribution of the points along the x and y-axes. The Spearman correlation rho and the associated p-value are shown in the top-right corner.

