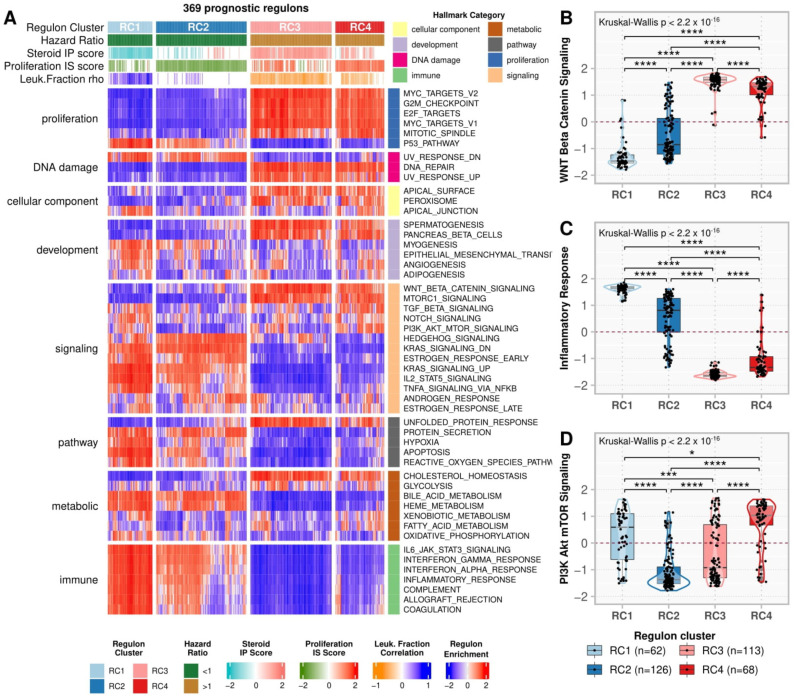
Figure 4.
Hallmarks enrichment analysis. (A) A heatmap representing the regulon activity enrichment analysis for the MSigDb Hallmarks. Each column represents a prognostic regulon grouped by the regulon cluster, and the rows represent the 50 Hallmarks divided by category. Both rows and columns were subjected to semi-supervised clustering within the groups. In the main heatmap, red indicates a positive enrichment score, while blue indicates the opposite. The top annotation depicts the regulons classification in the clusters, besides the overall survival (OS) hazard ratio (HR), the Steroid independent of Proliferation (IP) and Proliferation independent of Steroid (IS) scores, and the leukocyte fraction correlation for the regulons as presented in Figure 3A. (B–D) Boxplots comparing the enrichment scores in the regulon clusters for (B) Inflammatory Response, (C) WNT/β-Catenin Signaling, and (D) Mitotic Spindle Hallmarks. Each point represents a regulon separated by the regulon cluster in the x-axis and vertically spread according to its enrichment score for each Hallmark described. The contour presents the distribution density of the regulons for each cluster. The results of Kruskal-Wallis and Dunn’s tests for multiple pairwise comparisons of the ranked data are presented on top. Asterisks indicate the significance level as follows: * p ≤ 0.05, *** p ≤ 0.001, and **** p ≤ 0.0001.

