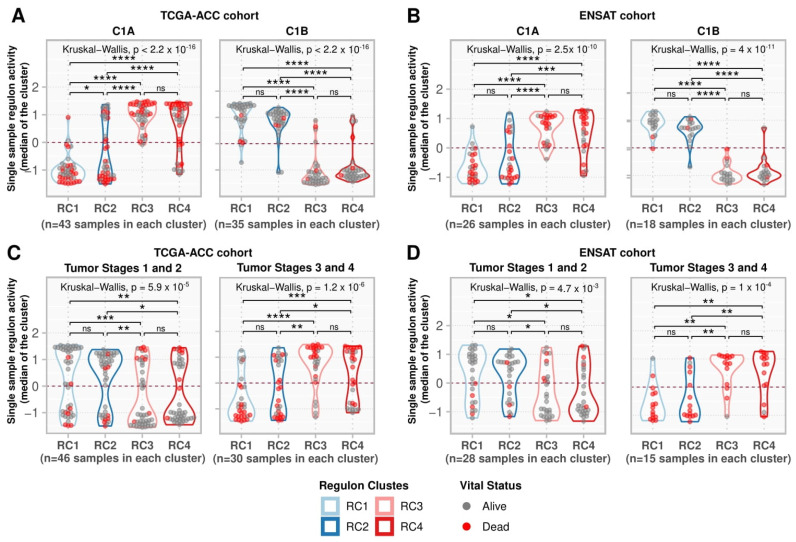
Figure 5.
Single-sample regulon activities in regulon clusters. (A,B) Samples were divided into C1A and C1B as assigned by Zheng et al. (2016) [7] for (A) the TCGA-ACC cohort and by Assié et al. (2014) [31] for (B) the ENSAT cohort. (C,D) Samples were divided into a group with tumor stages 1 and 2 and a group with tumor stages 3 and 4 for the (C) TCGA-ACC and (D) ENSAT cohorts. For each sample, the median regulon activity for each regulon cluster was calculated and represented by the values on the y-axis. Grey points indicate participants alive during the follow-up period, while red indicates participants who died during this time. The contour presents the distribution density of the sample. The results of Kruskal-Wallis and Dunn’s tests for multiple pairwise comparisons of the ranked data are presented on top. Asterisks indicate the significance level as follows: * p ≤ 0.05, ** p ≤ 0.01, *** p ≤ 0.001, and **** p ≤ 0.0001. Non-significant p-values (p > 0.05) are represented by “ns”.

