Figure 6.
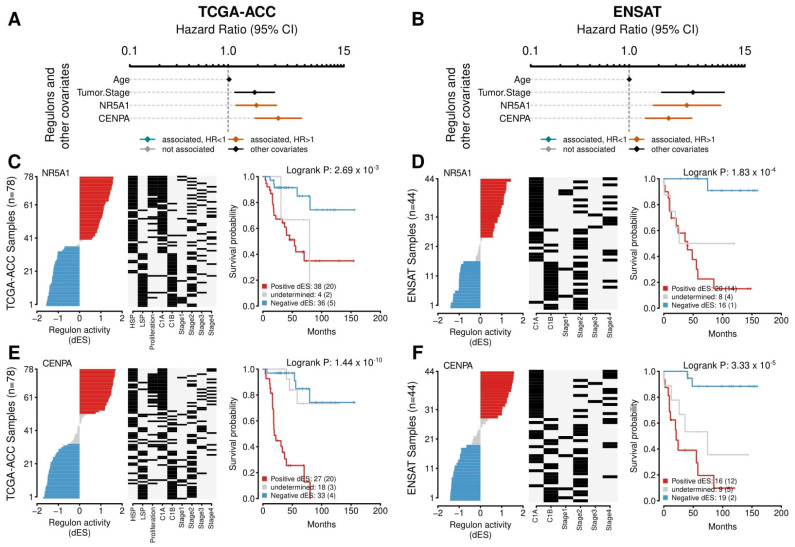
Survival analysis for the NR5A1 and CENPA regulons. (A,B) A Forest plot with the Hazard Ratios (HRs) and Confidence Interval (CI) for the Cox multivariate analysis. Age and Tumor Stage were used as covariates. The activities of the NR5A1 and CENPA regulons were evaluated for overall survival (OS). (A) presents the results for the TCGA-ACC cohort and (B) for the ENSAT cohort. (C–F) The Kaplan-Meier analysis for the NR5A1 regulon in the (C) TCGA and (D) ENSAT cohorts and for CENPA regulon in the (E) TCGA-ACC and (F) ENSAT cohorts. In the first and second panels, the rows represent the samples, which were ordered according to the differential enrichment score (dES) for the regulon activity and divided by the median into three groups: positive dES (red), negative dES (blue), and undetermined (grey) as depicted in the first panel. The middle panel shows the molecular classification for tumor stage for each sample, as provided by the publicly available data from the cohorts. The last panel shows the Kaplan-Meier survival analysis between the high and the low regulon activity groups. The adjusted p-value for the Log-Rank test is provided. The number of participants in each group is shown, followed by the number of events between parentheses.

